
Fig. 2.
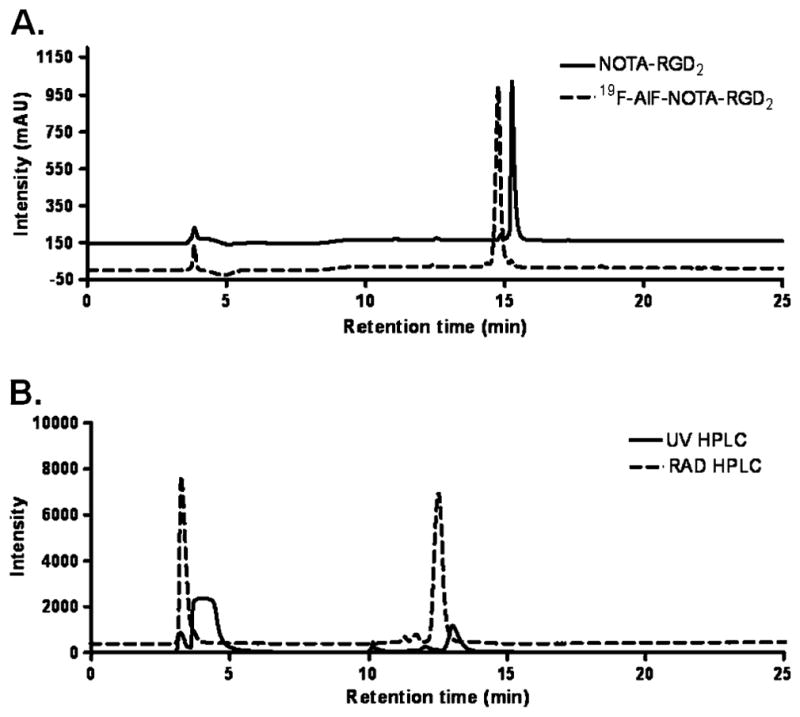
a The analytical HPLC for NOTA-RGD2 (solid line) and 19F-AlF-NOTA-RGD2 (dotted line). b HPLC chromatograms of 18F-AlF-NOTA-RGD2 purification. The relative intensity of UV was expressed as milli-absorbance unit (mAU) and RAD signals were expressed as millivolt (mV)