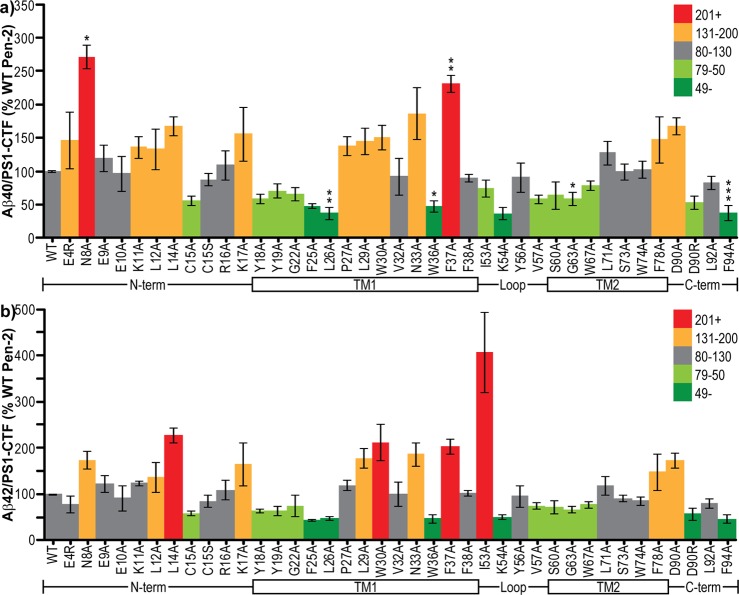
Figure 4.
γ-Secretase activity levels per mature complex. (a) Aβ40 or (b) Aβ42 concentrations in conditioned media per unit of PS1-CTF normalized to internal controls of wt human F-Pen-2. Colors denote the values above and below the wild-type value. The schematic below each graph aligns the regions of Pen-2 being mutated. Error bars show the standard error from 3–10 independent experiments. *P < 0.05. **P < 0.01. ***P < 0.001.

