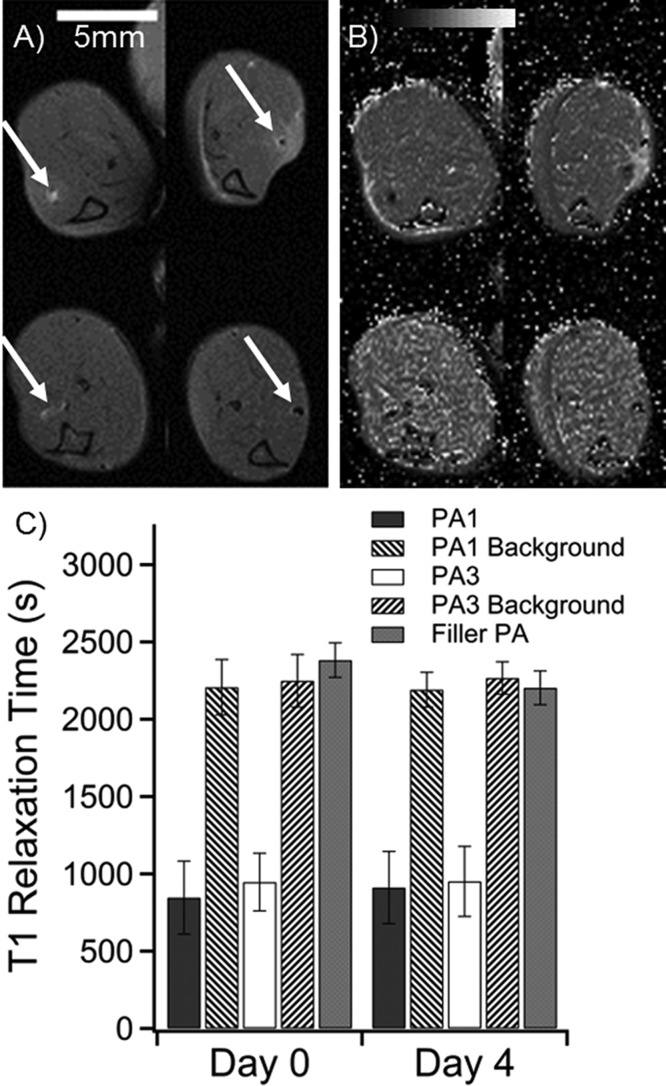
Figure 5.
Summary of in vivo measurements of PA1 and PA3 in a murine leg model. (A) Anatomical scan of mouse legs immediately after injection (top row) and after 4 days (bottom row). The PA injections are indicated by white arrows. PA1 produces positive contrast in white (left column), while PA3 produces negative contrast (right column). (B) T1 maps of the same mouse at the same image positions as in A. Dark areas represent regions with very short T1 times. (C) Averaged image T1 times from regions of interest for all mice at all slices where PA was visible. Filler (unlabeled) PA was not visible (Figure S27). Filler PA T1 was measured as a best approximation for PA position based on the injection location. Background was measured by averaging T1 values of muscle tissue several millimeters from the PA injection.

