
Figure 1.
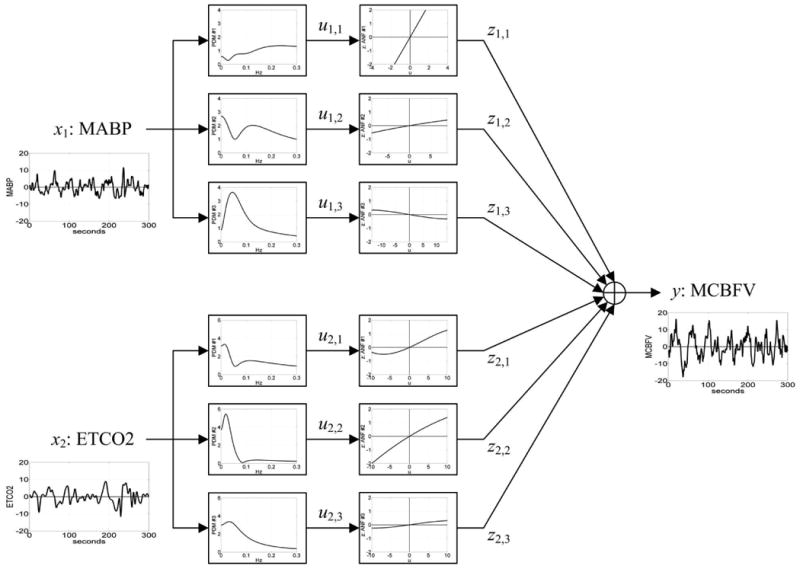
Block-diagram of PDM-based model of the cerebral hemodynamics with output y(t) the beat-to-beat Mean Cerebral Flow Velocity (MCBFV) and two inputs: x1(t) the Mean Arterial Blood Pressure (MABP) and x2(t) the End-Tidal CO2 (ETCO2). There are three PDMs for each of the two inputs shown in the diagram in the frequency domain (Transfer Functions) which are common for all subjects and are estimated from the data. The output uj,m(t) of the jth PDM for the mth input is the convolution of the PDM with the respective input (linear filter operation). The Associated Nonlinear Function (ANF) following each PDM is a cubic polynomial representing the system nonlinearities for the respective PDM and it is estimated from the data of each subject (subjectspecific). The output y(t) is the sum of all ANF outputs [zj,m] and a constant offset value c0.