Figure 2.

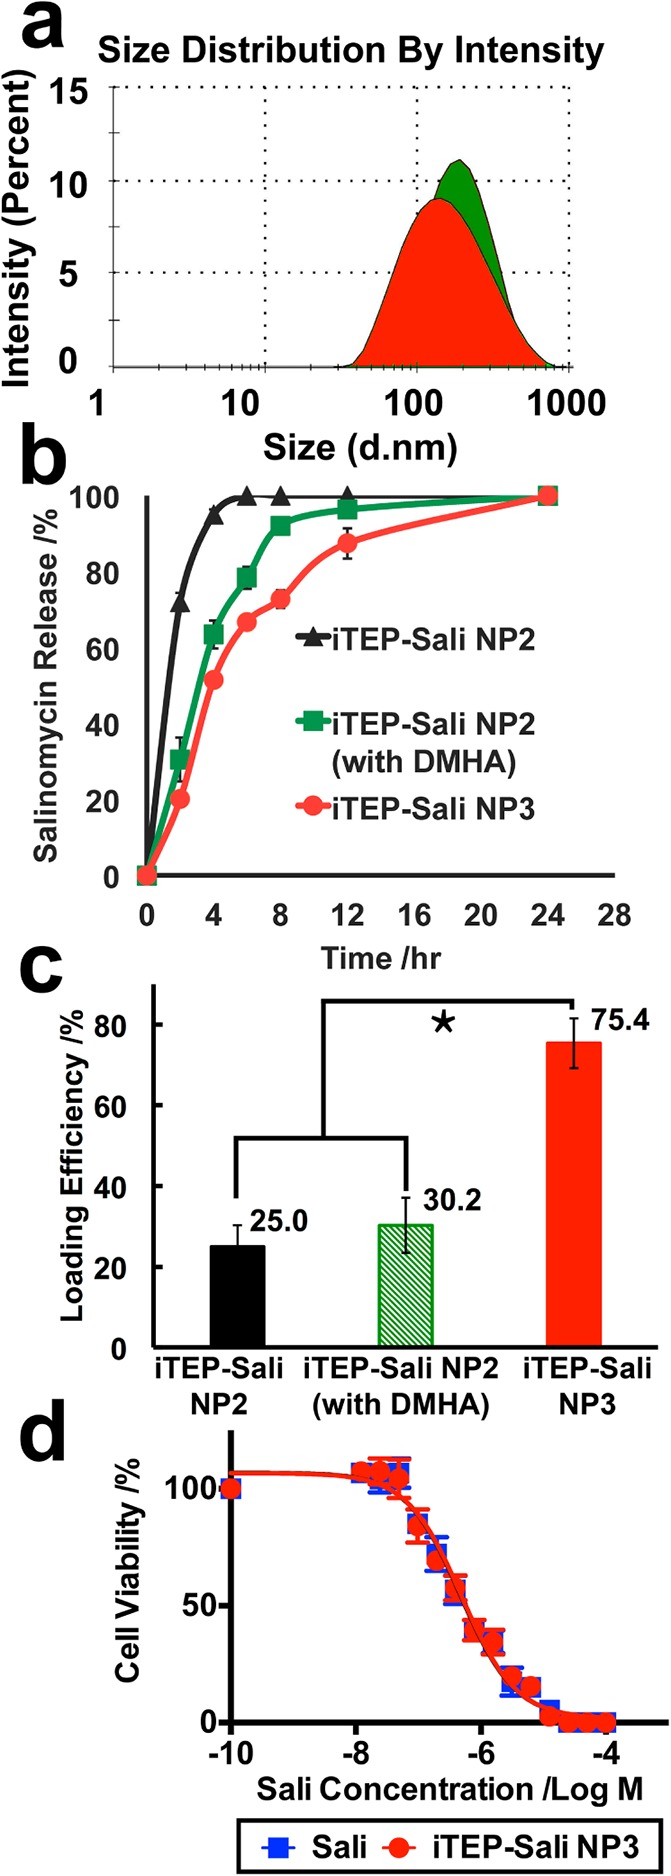
(a) Hydrodynamic diameters of iTEP–Sali NP2 (green filled area) and iTEP–Sali NP3 (red filled area) at 37 °C in PBS. The sample concentrations were 25 μM for both. The measurements were performed using DLS at 37 °C. (b) The release profile for Sali from TEP-Sali NP2, iTEP–Sali NP2 with DMHA, and iTEP–Sali NP3 respectively. The quantity of released Sali was determined by HPLC in combination with a precolumn derivatization with DNPH. The Sali release data were fit to a release model described in the Supporting Information. (c) The loading efficiency of Sali by NP2, NP2 plus DMHA, or NP3. The * indicates that the differences between the NP3 and NP2 or NP2 plus DMHA are statistically significant with a p < 0.0001 analyzed by one-way ANOVA. (d) Viability profiles of 4T1 mammosphere cells after they were exposed to different concentrations of Sali or iTEP–Sali NP3 for 48 h. The IC50 of free Sali is 0.49 μM with a 95% CI = 0.40–0.60 μM. The IC50 of the NP3 is 0.48 μM with a 95% CI = 0.35–0.59 μM.
