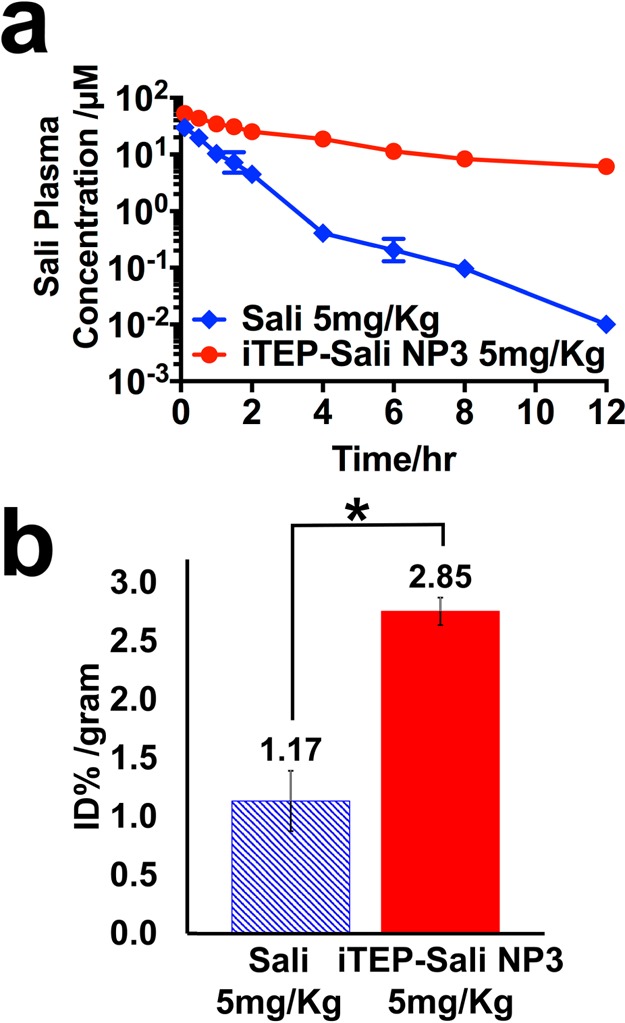
Figure 3.

(a) Plasma Sali concentrations after they were administered as free form (blue line) or as encapsulated form in iTEP–Sali NP3 (red line) through intravenous injection. The concentrations were determined by HPLC in combination with a precolumn derivatization with DNPH. The Sali plasma concentration was plotted on the log scale based on 10 as a function of time postinjection. (b) Tumor accumulation of Sali after they were administered as free form (blue bar) or as encapsulated form in iTEP–Sali NP3 (red bar) through intravenous injection. The presented data are for tumor samples collected at 12 h post intravenous injection at 5 mg/kg. The quantities of Sali were expressed as percentage of initial dose normalized by weight of tumor, % ID/gram. The * indicates that the difference between Sali and iTEP–Sali-NP3 is statistically significant with a p = 0.0031 analyzed by one-way ANOVA.
