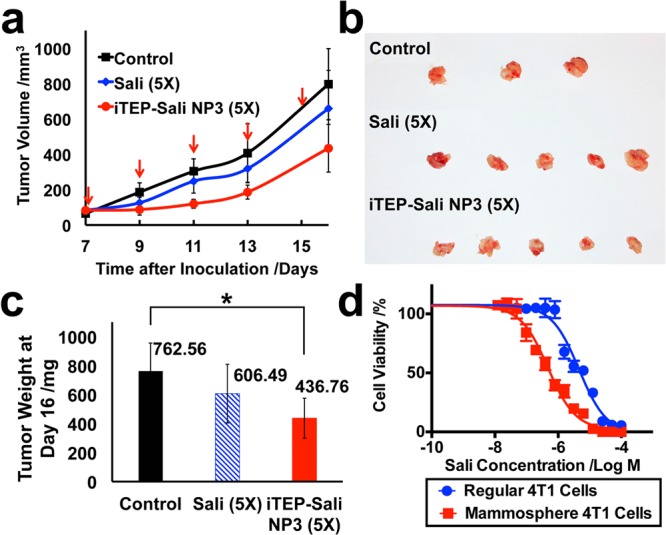
Figure 5.

(a) The size changes of 4T1 orthotopic tumors after they were treated by five doses of controls (PBS), free Sali, or iTEP–Sali NP3. Both free Sali and the NP-encapsulated Sali were administered at 5 mg/kg. The five dosing dates are indicated as red arrows. The tumor dimensions were measured at the same day of dosing except for the last measurement, which was performed at day 16 post tumor inoculations. (b) Photos of the tumors collected at day 16 after the inoculations. (c) The mean tumor weights of each group of mice at the day 16 post tumor inoculations. The mean values were compared by one way ANNOVA. The * indicates a significant difference between the connected two means (p = 0.0307). (d) The viability profile of regular 4T1 cells versus 4T1 mammosphere cells after they were exposed to different concentrations of iTEP–Sali NP3 for 48 h. The IC50 of the NP3 to regular 4T1 cells 4.56 μM with a 95% CI = 3.49–5.95 μM. The IC50 of the NP3 to 4T1 mammosphere cells 0.48 μM with a 95% CI = 0.35–0.59 μM. The two IC50 are statistically different.
