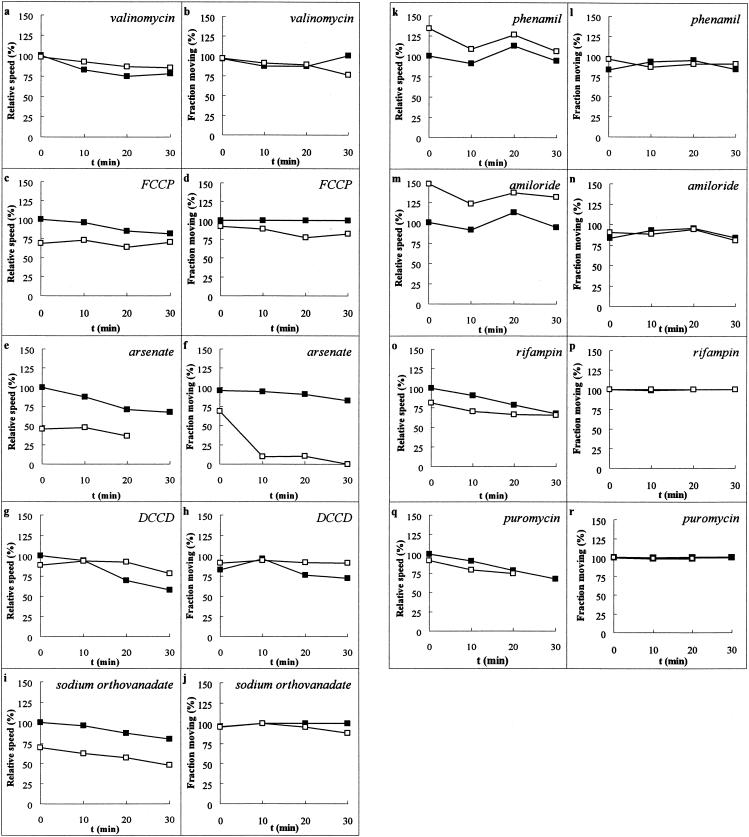
FIG. 3.
Effect of ionophores, inhibitors, and poisons on gliding. Various agents were added (Table 1), and gliding was compared to that of a matched control. The graphs on the left-hand side of each pair show the speed of the cells that were moving at speeds greater than 0.25 μm/s relative to the initial speed of the cells in the matched control. The graphs on the right-hand side of each pair show the fraction of cells moving. (a and b) 10 μM valinomycin; (c and d) 10 μM FCCP; (e and f) 10 mM arsenate (note that no 30′ test time point is shown [e] because no cells were moving at speeds greater than 0.25 μm/s); (g and h) 10 μM DCCD; (i and j) 1 mM sodium orthovanadate; (k and l) 10 μM phenamil; (m and n) 10 μM amiloride; (o and p) 5 μg of rifampin/ml; (q and r) 20 μM puromycin (note that the 30-min test time point was not taken due to technical difficulties). Filled squares are matched control preparations. Open squares are test preparations. Error bars are omitted for clarity, but standard deviations in speeds were generally ±25%.

