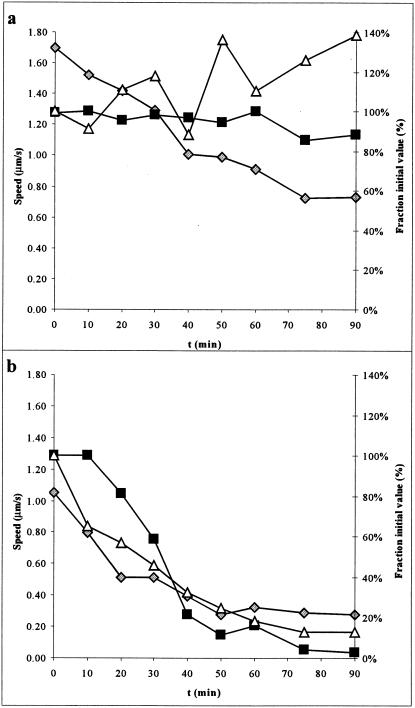
FIG. 5.
Effect of arsenate on gliding motility and ATP levels. Parallel preparations were assayed for motility and ATP. (a) PBS-K/G (pH 8.0); (b) ArBS-K/G (50 mM arsenate). Filled squares indicate the fraction of cells moving (right axis), gray diamonds indicate gliding speed (left axis), and open triangles indicate the fraction of ATP remaining compared to the value at t = 0 (right axis). Note that error bars have been omitted for clarity. Standard deviations in speeds were generally ±20%, while standard deviations for ATP values were <5%.

