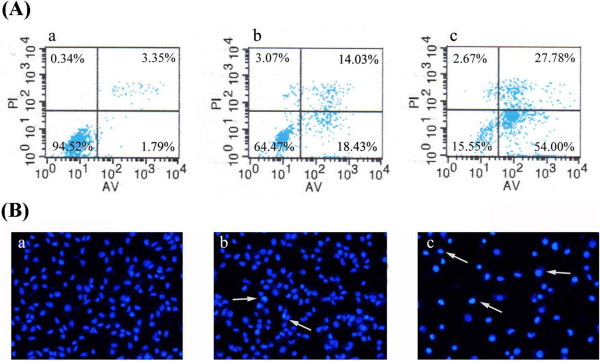
Figure 3.

Hederagenin-induced apoptosis (A) and apoptotic morphological changes (B) in LoVo cells. a, control; b, 1 μΜ hederagenin; c, 2 μΜ hederagenin. LL(lower left), living cells (AV/PI negative); LR (lower right), early apoptotic cells (AV positive/PI negative); UR (upper right), late apoptotic cells (AV positive/PI positive); UL(upper left), necrotic cells(AV negative/PI positive). The numbers represent the percentage of the cells in the sum of upper right and lower right quadrants. For apoptotic morphological changes, apoptotic cells were detected by Hoechst 33342 staining and measured by fluorescence microscopy (magnification 200×).
