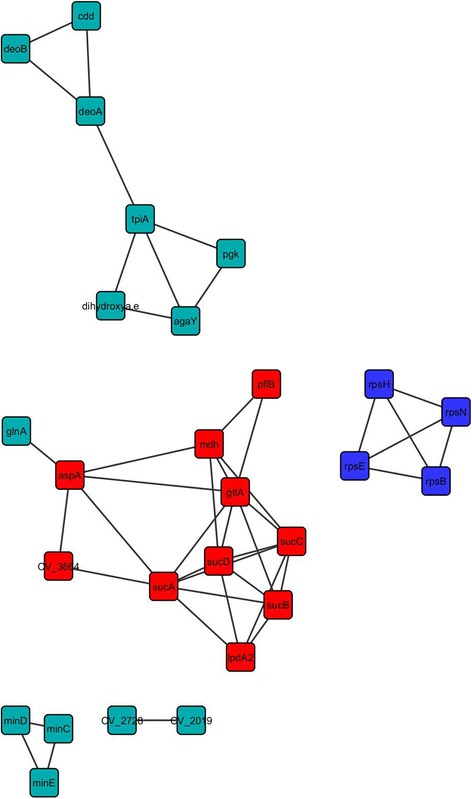
Figure 4.

Protein interaction network of the iron-responsive proteome. The protein input was the data obtained from the proteomics analysis. Only the proteins that were up-regulated or exclusively identified in the iron responsive proteome were used in the construction of the protein-protein interaction network. The red and blue nodes represents the two clusters obtained with the MCODE plug-in, in which the red ones are the proteins related to energetic metabolism and the blue dots are ribosomal proteins.
