Figure 2.

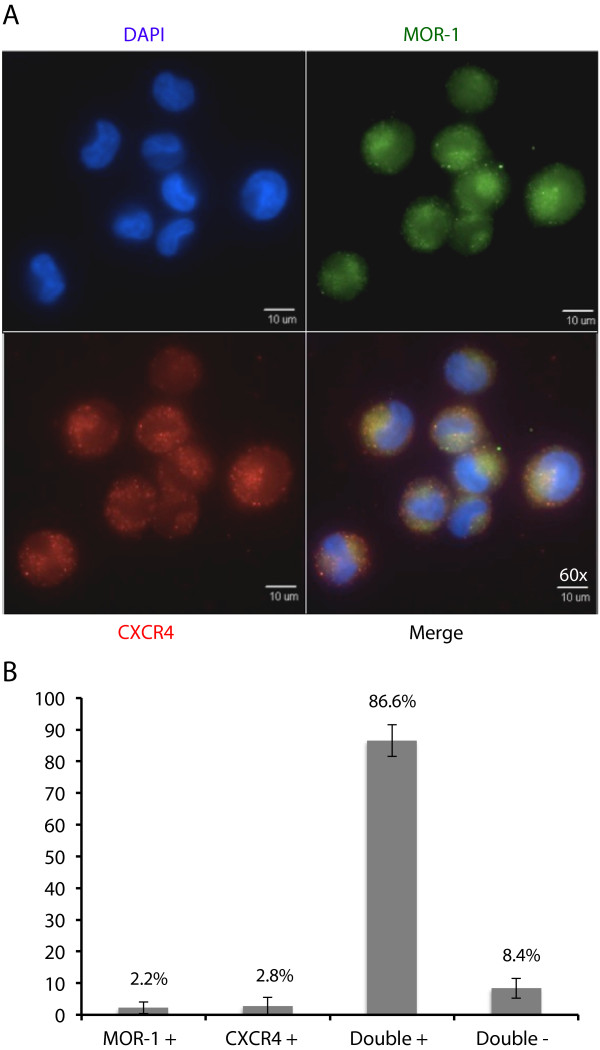
TF-1 cells express MOR-1 and CXCR4 in overlapping domains. (A) TF-1 cells were cultured and stained as described above. Briefly, TF-1 cells were grown on poly-D-lysine coated coverslips and stained, nonpermeabilized, with primary antibodies directed against MOR-1 and CXCR4, and with DAPI (4',6-diamidino-2-phenylindole) staining to show nuclear morphology. The upper left panel demonstrates a nuclear reaction with DAPI (in blue). The upper right panel demonstrates a surface reaction pattern for MOR-1 (in green). The bottom left panel also demonstrates a surface reaction pattern for CXCR4 (in red). The bottom right panel is an overlay showing the relative expression of MOR-1 and CXCR4. These images are representative of all fields captured. All images were obtained at 60× with an Olympus IX81 deconvolution microscope. (B) TF-1 cells were quantified by counting a total of 1000 cell nuclei, and these cells were then characterized based on MOR-1 and CXCR4 staining as single-positive for either protein, double-positive, or double-negative. This analysis shows that the majority of TF-1 cells are double-positive for surface expression of the two proteins.
