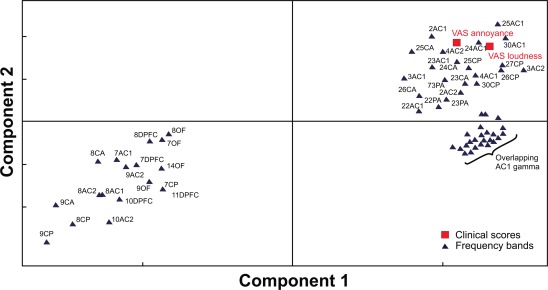
Figure 6.

Loading plot showing the 67 1‐Hz wide power bands and VAS loudness and VAS annoyance scores. Proximity of the changes in the power values across different frequency bands to the changes in VAS reflects the strength of association of these neuronal changes to the changes in the clinical scores. For ROI abbreviations, see METHODS section and Figure 5.
