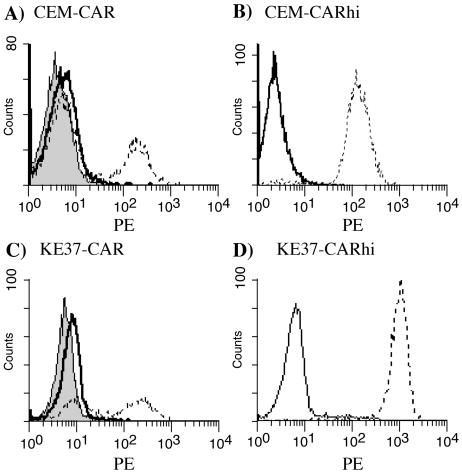
FIG. 2.

CAR expression on transduced cells. CEM (A) and KE37 (C) cells were infected with either the control LXSN retrovirus (solid lines) or the LXSN-hCAR retrovirus (dashed lines), grown in G418 selection, stained with anti-CAR, and analyzed by flow cytometry as described in the legend to Fig. 1. Shaded peaks represent staining with an isotype control antibody. CEM-CAR and KE37-CAR were sorted to isolate cells with the highest levels of CAR. (B and D) Surface CAR expression (dashed lines) 1 week post-sort on the CEM-CARhi and KE37-CARhi cells, respectively. Solid lines represent staining with an isotype control.
