
FIG. 3.
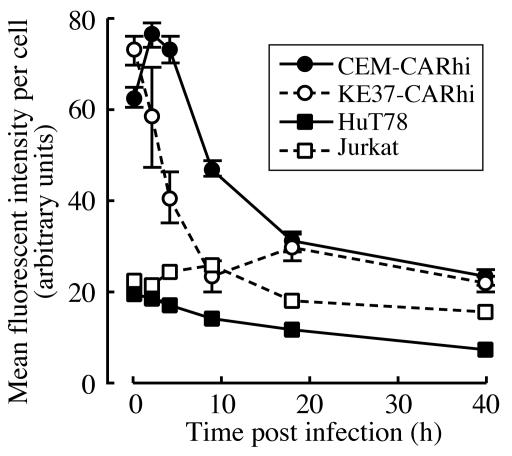
Time course of Ad-568 fluorescence following infection. The indicated cells were infected with 30 PFU of Ad-568 per cell for 1 h on ice and then were returned to normal growth conditions. At each time point indicated a portion of the infected cells was processed for quantitative fluorescent microscopy as described in Materials and Methods. The mean fluorescence intensity, representing the amount of Ad-568 per cell, was determined for each of 20 to 300 cells. The data are expressed as average values ± standard errors of the means.