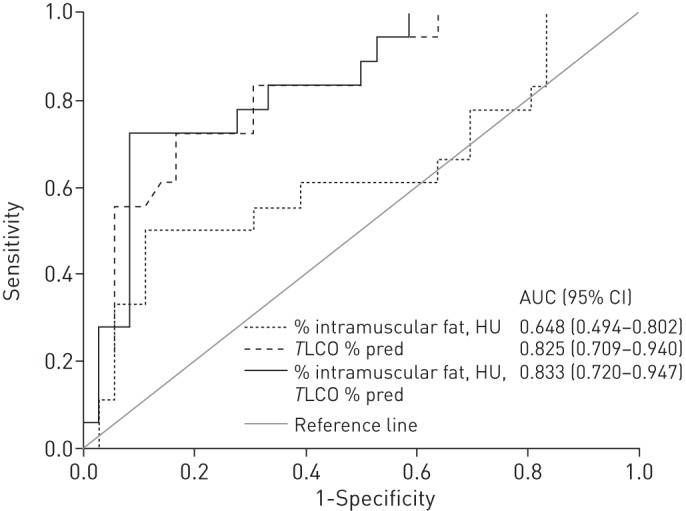
Figure 4–

Receiver operating characteristic curves for transfer factor of the lung for carbon monoxide (TLCO) % predicted and measures of skeletal muscle adiposity and areas under the curve (AUC) (95% CI). Optimal sensitivity/specificity values for the dark solid line: 88.9/50.0%; 83.3/66.7%; 77.8/82.2%; 72.2/91.1%.
