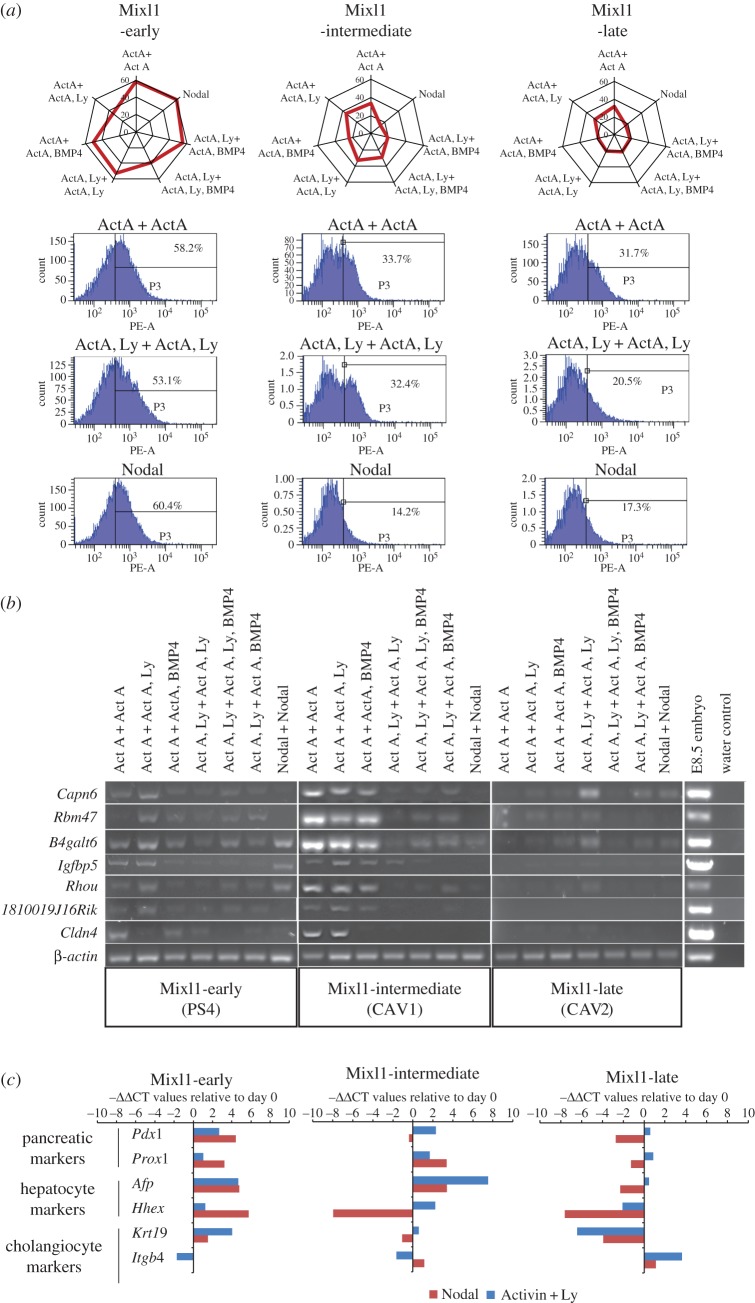
Figure 2.
Differentiation of EpiSCs to endoderm lineages. (a) The level of enrichment of CXCR4-positive cells in day-4 EBs generated from EpiSCs of the three Mixl1 categories. Radar graphs (top row) show the data of all seven culture conditions (radial axis: level (%) of enrichment). Flow cytometry results and the % CXCR4-positive cells in the samples are shown for three conditions (rows 2–3) for each Mixl1-group. (b) PCR analysis of the expression of foregut endoderm genes in day-4 EBs cultured in seven conditions. Integrity of the cDNA sample was ascertained by PCR analysis of a housekeeping gene, β-actin. (c) Expression of Pdx1, Prox1 (pancreatic markers), Afp, Hhex (hepatocyte markers) and Krt19, Itgb4 (cholangiocyte markers) after 9-day directed differentiation of EpiSCs of the three Mixl1 categories. EpiSCs were cultured in either Activin A + Ly or Nodal at day 1–4. Gene expression level is presented as the negative value of the relative difference in threshold cycles (−ΔΔCT; normalized against Actb) relative to day 0 value. Positive value, upregulation; negative value, downregulation. (Online version in colour.)

