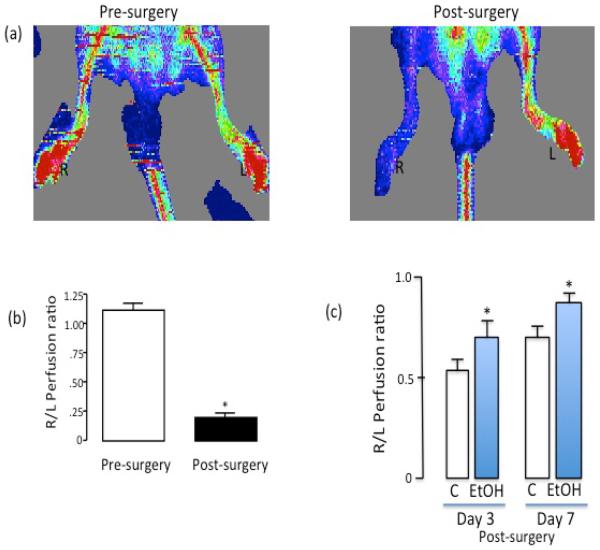
Figure 5.
(a) Representative laser doppler flow images of a C57Bl/6 mouse pre- and post-surgery (i.e., femoral artery ligation). R (right) and L (left) foot. Low perfusion is depicted as blue color, whereas red color represents high perfusion. (b) Changes in perfusion after ligation shown as a ratio of right to left hindlimb (R/L ratio). Cumulative data, n=3. (c) Greater perfusion 3 days and 7 days post femoral artery ligation in moderate ethanol fed animals, compared to controls. n=4–6. *p<0.05 vs control.

