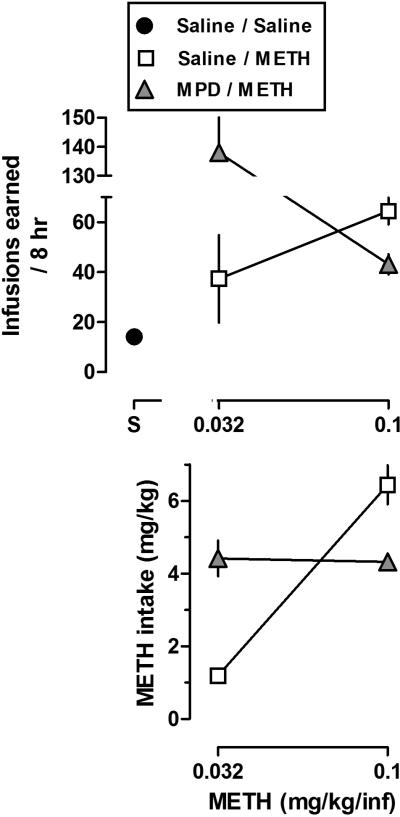
Fig. 3.
Dose-response curves for METH infusions (upper panel) or intake (lower panel) generated from data presented in Figs. 1B and 2B. Data represent the mean ± SEM of the last three sessions for each dose of drug. For the saline data point, the mean ± SEM number of infusions during the last three sessions was averaged across the two experiments. Horizontal axes: dose in milligrams per kilogram of body weight. Vertical axes: mean (± SEM) infusions or METH intake (mg/kg).

