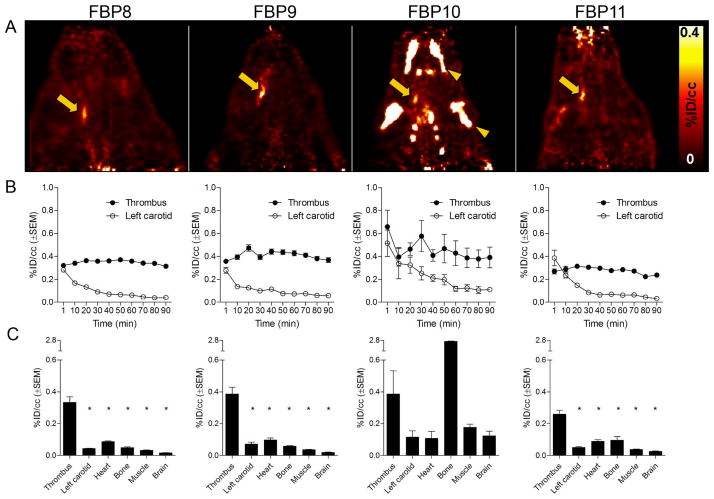
Figure 3.
Side-by-side comparison of: PET images (A) after injection of FBP8 (n=7), FBP9 (n=5), FBP10 (n=3) and FBP11 (n=5); correspondent time-activity curves (B) of thrombus and left carotid obtained from dynamic PET imaging; correspondent mean PET activity values (C) of thrombus, left carotid, heart, bone, muscle and brain (30–90 min post-injection). Bone activity for FBP10 is off scale. Arrow, thrombus; arrowhead, bone uptake. * p<0.0001, vs. Thrombus.

