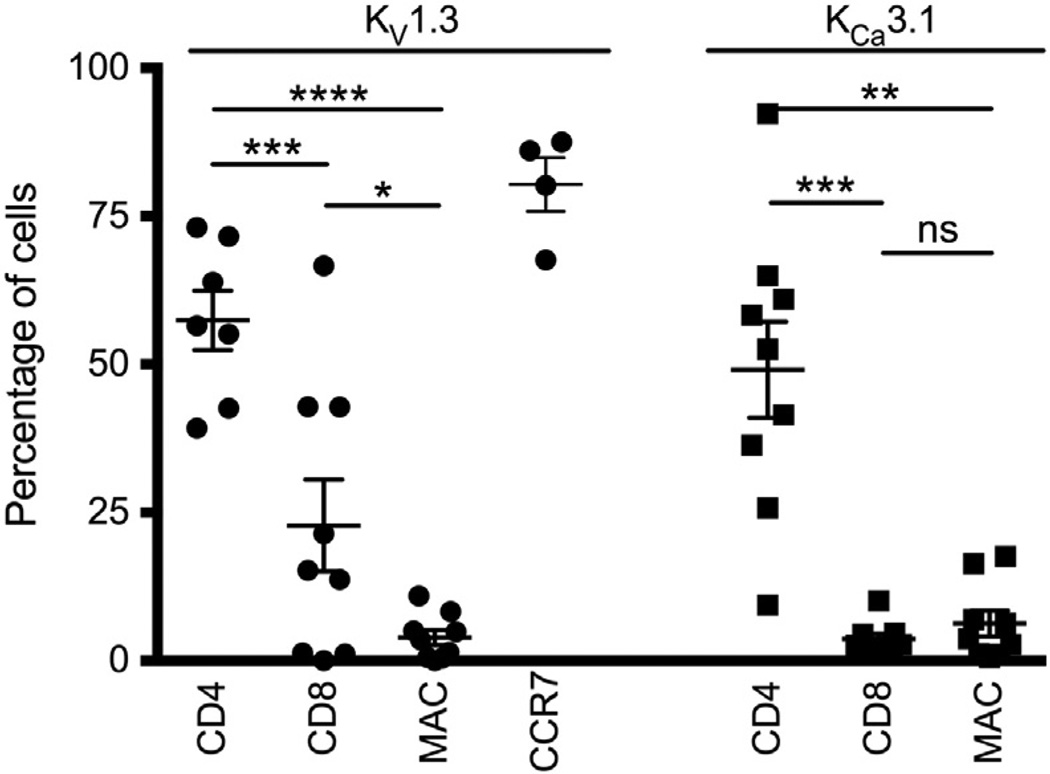
Figure 5.
The left side of the graph shows the percentage of KV1.3 immunofluorescence that co-localize with CD8, CD4, macrophages and Chemokine Receptor 7 (CCR7) after analyses with the Cell Profiler software. The right side shows the percentage of KCa3.1 immunofluorescence co-localizing with CD4, CD8 and macrophages. Error bars show mean ± SEM.

