Figure 1.

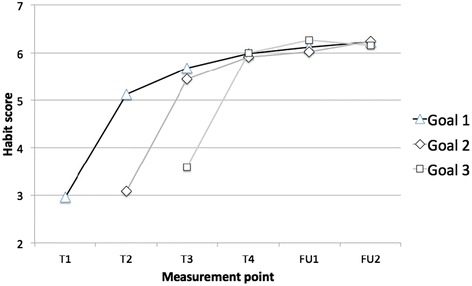
Trajectory of mean automaticity scores over time. Goal 1 = all goals set at T1; Goal 2 = all goals set at T2; Goal 3 = all goals set at T3.

Trajectory of mean automaticity scores over time. Goal 1 = all goals set at T1; Goal 2 = all goals set at T2; Goal 3 = all goals set at T3.