
Figure 5.
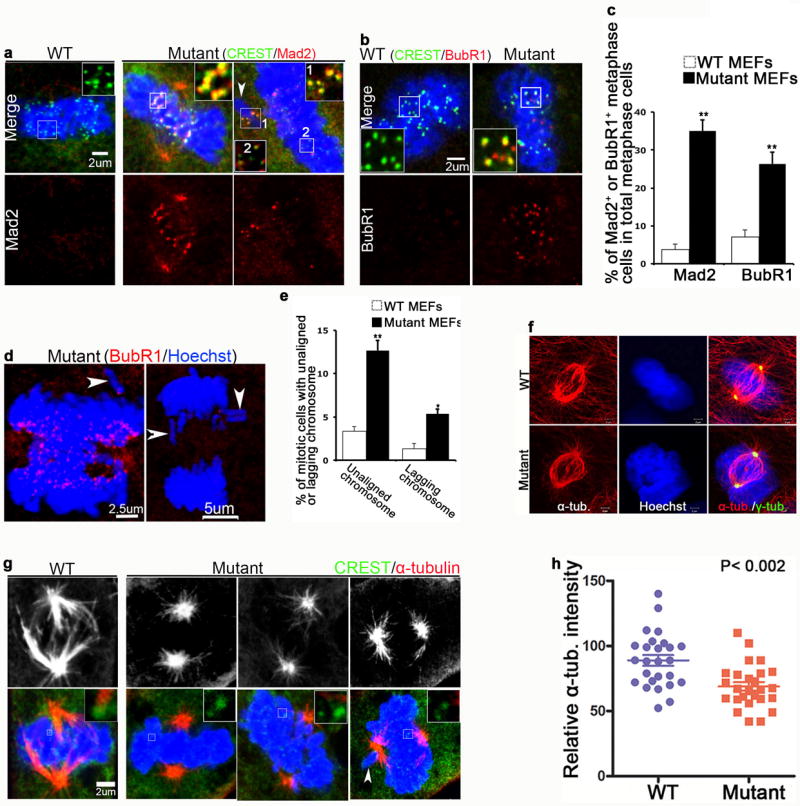
Wdr62 regulates spindle assembly and its depletion activates the spindle checkpoint. (a,b) Wild type and mutant MEFs at metaphase were co-stained for CREST (green), Mad2 (red in a), and BubR1 (red in b). Inserts show single focal planes of boxed regions. White arrowhead in a points to unaligned chromosome. Bar: 2 um. (c) Quantification of percentage of Mad2 or BubR1 positive metaphase cells out of total metaphase cells in a, b, respectively. Data represent s.e.m. of three independent experiments, counting at least 50 metaphase cells per experiment (p< 0.05, student’s t-test). (d) Confocal microscope images of mutant cells at anaphase stained with BubR1. Hoechst stains nuclei (blue). White arrowheads mark unaligned or lagging chromosomes. Bar: 2.5 um, 5 um. (e) Quantification of percentage of mitotic cells with unaligned or lagging chromosomes. Data represent s.e.m. of three independent experiments, counting at least 50 metaphase or anaphase cells per experiment (**p< 0.01, *p<0.05, student’s t-test). (f) Confocal microscope images of WT and mutant MEFs in metaphase stained with antibodies against α-tubulin (red) and γ-tubulin (green). Hoechst stains nuclei (blue). Bar: 2 um. (g) Confocal microscope images of MEFs incubated at 4°C for 40 min and co-stained with antibodies against α-tubulin (red) and CREST (green). Hoechst stains nuclei (blue). Inserts show single focal planes of boxed regions. White arrowhead points to unaligned chromosome. Bar: 2 um. (h) The relative intensity of α-tubulin (red) within metaphase spindle was measured using quantitative fluorescence imaging. Data represent s.e.m. of >25 cells for each genotype (p = 0.002, student’s t-test).