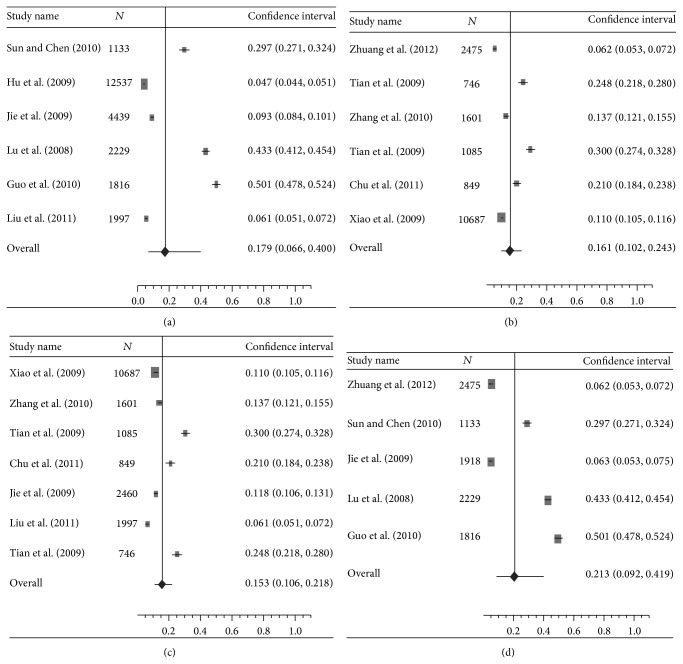
Figure 3.
(a) A forest plot displaying the pooled prevalence of DES in individuals living in Northern China. (b) A forest plot displaying the pooled prevalence of DES in individuals living in Southern China. (c) A forest plot displaying the pooled prevalence of DES in individuals living in urban China. (d) A forest plot displaying the pooled prevalence of DES in individuals living in rural China.

