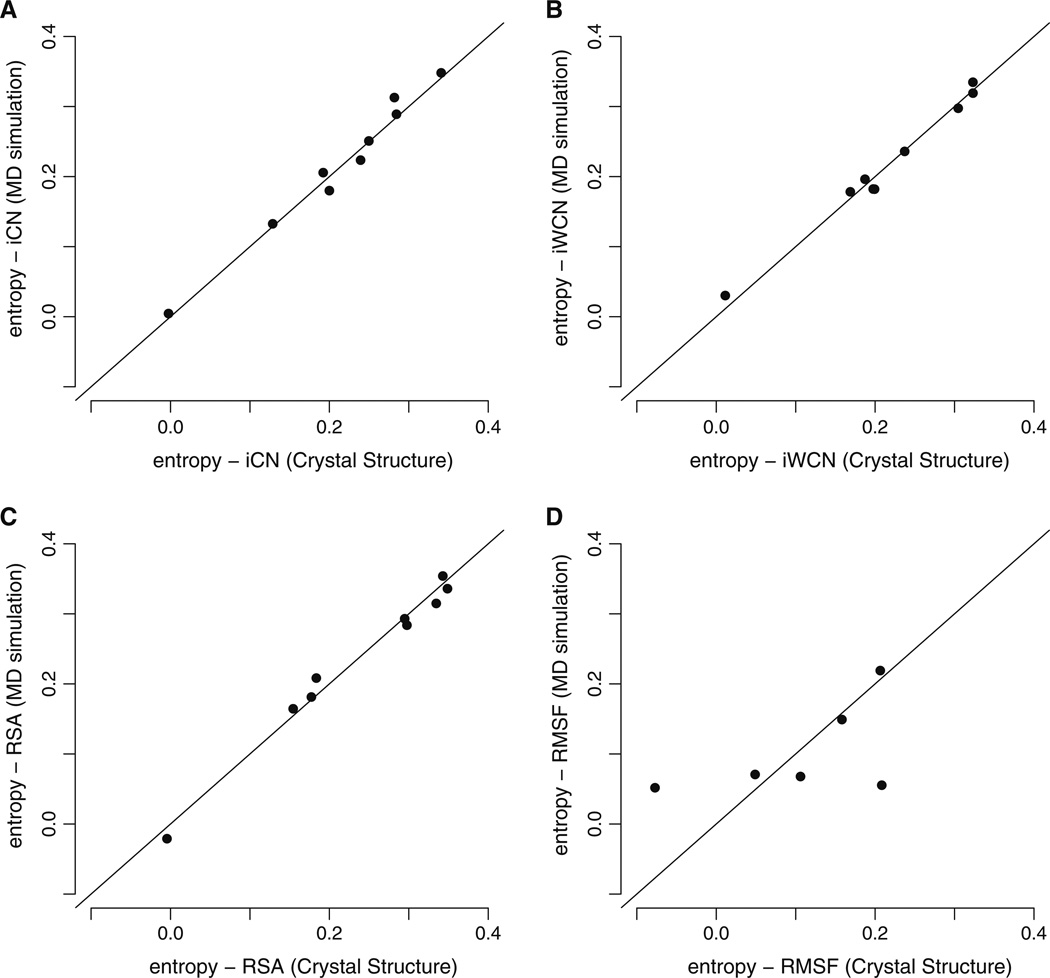
Fig. 3.
Spearman correlations of sequence entropy with MD-derived and crystal-structure derived structural measures. The vertical axes in all plots represent the Spearman correlation of sequence entropy with one structural variable obtained from 15ns of molecular dynamics (MD) simulations. The horizontal axes represent the Spearman’s rank correlation coefficient of sequence entropy with the same structural variable as in the vertical axes but measured from protein crystal structures. Each dot represents one correlation coefficient for one protein structure. The quantities iCN, iWCN, and RSA have nearly identical predictive power for sequence entropy regardless of whether they are derived from MD simulations or from crystal structures. By contrast, MD RMSF yielded very different correlations than did CS RMSF

