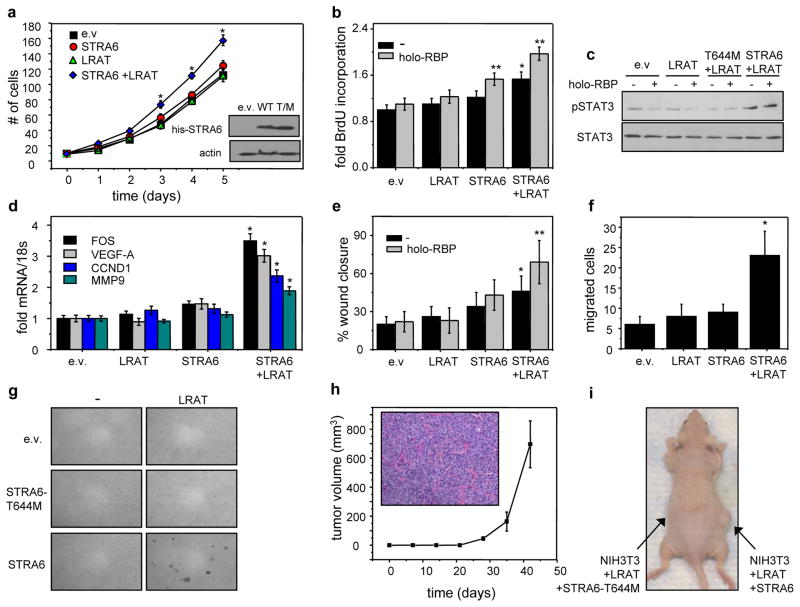
Figure 6. STRA6 and its associated machinery induce oncogenic transformation.
a) Growth curve of NIH3T3 fibroblasts stably overexpressing e.v, STRA6, LRAT, or co-expressing STRA6 and LRAT. Inset: Immunoblots demonstrating expression of his-STRA6 and his-STRA6-T644M in NIH3T3 cells. Data are mean±S.E.M. (n=3)*p<0.05 vs. e.v.-expressing cells. b) BrdU incorporation in NIH3T3 fibroblasts overexpressing e.v, STRA6, LRAT, or both and treated with vehicle or 1 μM holo-RBP. Mean±S.E.M. (n=3). *p<0.05 vs. e.v.-expressing cells, **p<0.05 vs. corresponding untreated cells. c) Immunoblots of pSTAT3 and STAT3 in NIH3T3 cells expressing denoted constructs and treated with vehicle or 1 μM holo-RBP for 15 min. d) Levels of mRNAs of STAT target genes in NIH3T3 cells expressing e.v. or vectors encoding STRA6, LRAT, or both. Cells were treated with 1 μM holo-RBP for 4 h.*p<0.05 vs. e.v.-expressing cells. e) Scratch assay conducted with NIH3T3 fibroblasts expressing denoted constructs and treated with vehicle or 1 μM holo-RBP for 24 h. *p<0.05 vs. e.v.-expressing cells, **p<0.05 vs. corresponding untreated cells. f) Migration assays using NIH3T3 fibroblast sectopically expressing denoted proteins. *p<0.05 vs. e.v.-expressing cells.*p<0.05 vs. e.v.-expressing cells. g) Soft agar colony formation assays using NIH3T3 cells expressing denoted constructs. Colonies were allowed to form for 28 days. Data are mean±S.E.M. (n=3). h) NCr athymic male mice were injected with 5×10⁶ NIH3T3 fibroblast co-expressing LRAT and STRA6 into the right flank and LRAT and STRA6-T644M into the left flank. Tumor growth was monitored for 40 days. No tumors arose in sites injected with cells co-expressing LRAT and the STRA6-T644M mutant. mean±S.E.M. (n=5). Inset: H&E staining of fibrosarcoma that developed from NIH3T3 cells co-expressing STRA6 and LRAT. i) Image of a representative mouse 40 days following injection of denoted cells. Data are Mean±S.E.M. (n=3).

