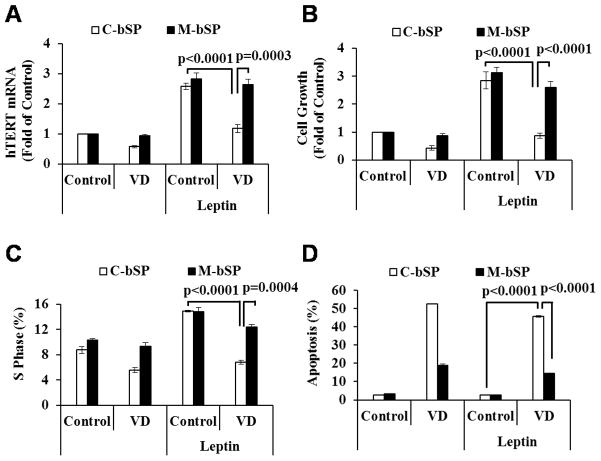
Figure 4. 1,25(OH)2D3 works through miR-498 to suppress leptin-induced hTERT expression and cell proliferation.
A, Control (C-bSP) or miR-498 (M-bSP) sponges were stably transfected into BG1-cells. The stable clones were treated with EtOH (Control), 10−7 M VD, leptin (100 ng/ml) or 10−7 M VD plus leptin (100 ng/ml) for 3 days. Total RNAs were extracted and the expression of hTERT was determined by qRT-PCR and normalized to GAPDH. The values are expressed as fold of the control. B, Cells were treated as in panel A but for 6 days. Cell growth was measured in MTT assays. C, Cells were treated as in panel B and stained with propidium iodide. Cell cycle distribution was assessed by flow cytometry. D, Cells were treated as in panel B. Apoptosis was measured by FITC Annexin-V analyses. Data represent three independent experiments and are presented as the mean ± SD. Statistical analyses were performed with Student’s t test (n=3 in panels A, C and D, n=10 in panel B).

