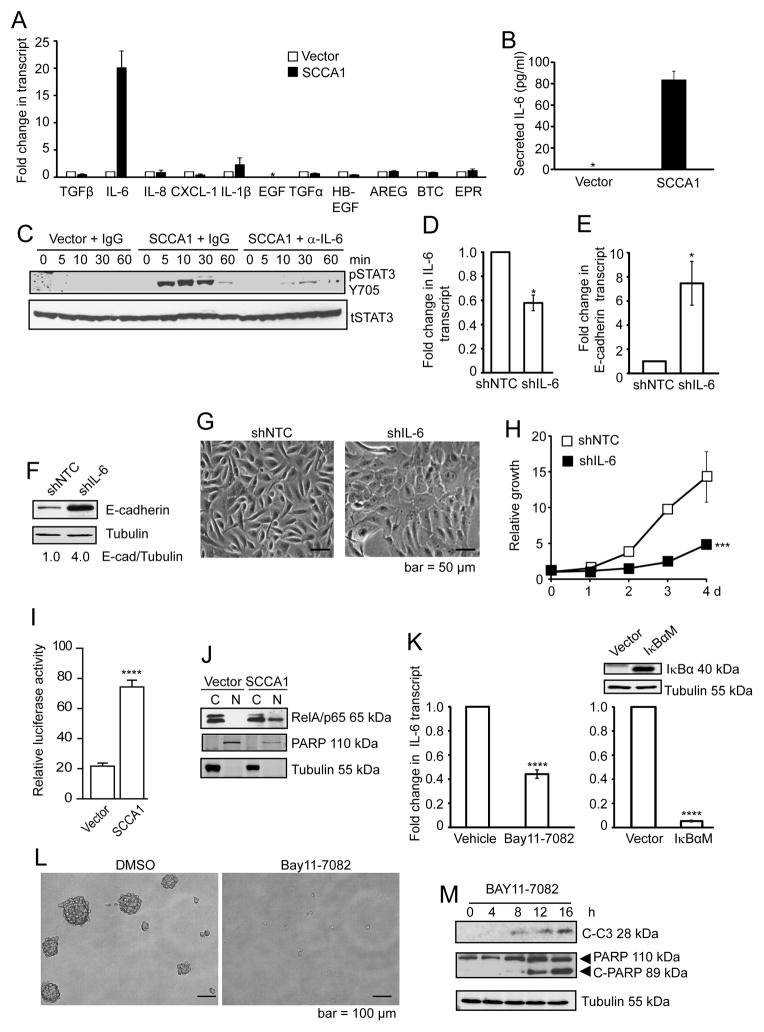
Figure 4. SCCA1 promotes IL-6 expression by activating NF-κB.
(A) Total RNA isolated from vector control or SCCA1-expressing MCF10A cells were analyzed for the expression of indicated hormonal ligands by qRT-PCR. Data shown is the mean transcript level normalized to that of vector control cells + S. D. of triplicate experiment. *EGF was below detectable level. (B) Cell culture medium of vector control and SCCA1-expressing cells from overnight cultures was collected and measured for the level of secreted IL-6 by ELISA. *the absolute concentration of IL-6 in the control cells was below the sensitivity of the kit (3.25 pg/ml). Data shown are the mean + S.D. of two independent experiments performed in triplicates. (C) Vector control or SCCA1-expressing cells were cultured in EGF-free medium for 24 h. The medium from vector control cells was incubated with control IgG, and that from SCCA1 cells was incubated with IgG or an IL-6 neutralizing antibody. These media were added to EGF-starved MCF10A cells. Whole cell lysates were collected at indicated times and probed for phospho-Stat3 (Y705) and total Stat3. (D–H) SCCA1-expressing MCF10A cells at early passage (passage #3) were infected with control (shNTC) and IL-6 (shIL-6) shRNA for 4 days. (D and E) Total RNA was analyzed by qRT-PCR for IL-6 (D) and E-cadherin (E) transcript levels. Data shown is the average +/− SEM of three independent experiments performed in triplicate. *p<0.05. (F) Whole cell lysates were analyzed by immunoblotting. (G) Phase-contrast images of the cell culture was taken. (H) Relative cell proliferation was determined by crystal violet staining. Data shown is the mean +/− S.D. of three independent experiments in duplicates. ***p < 0.001. (I) Indicated cells were transfected with the NF-κB luciferase reporter and a renilla luciferase construct. 24 h post-transfection, NF-κB luciferase activity was calculated by normalizing against the renilla luciferase activity. Data shown is a representative graph of three independent experiments performed in triplicates, showing the mean + S.D. ****p<0.0001. (J) Indicated cells were subjected to subcellular fractionation. The cytosol (C) and nuclear (N) fractions were analyzed by immunoblotting. (K) Left panel: Cells were treated with either DMSO or 5 μM BAY-117082 for 4 h. Right panel: SCCA1-expressing cells were retrovirally infected with vector control or IκBαM (S32A, S36A) for 4 d. Expression of IκBαM was verified by immunoblotting. IL-6 transcript level was analyzed by qRT-PCR. Data shown are the mean +/− SEM of three independent experiments performed in triplicate. ****p<0.0001. (L and M) SCCA1-expressing MCF10A cells cultured in non-adherent culture dish, in the presence of DMSO or 5 μM BAY-117082, for 4 d. Phase contrast image of the cell culture was taken (L) and indicated proteins were probed by immunoblotting (M).

