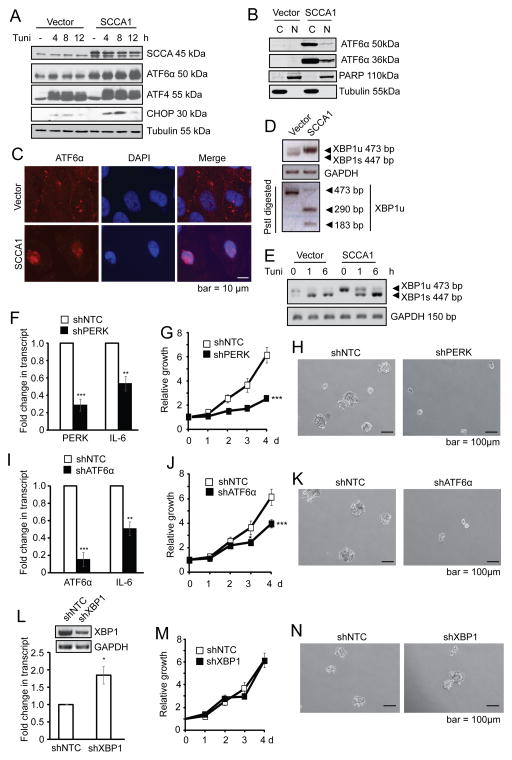
Figure 5. SCCA1 induces chronic UPR that is essential for IL-6 production and transformation.
(A) Vector control or SCCA1-expressing MCF10A cells were treated with 5 μM tunicamycin and analyzed by immunoblotting. (B) Cells were subjected to subcellular fractionation. The cytosol (C) and nuclear (N) fractions were analyzed by immunoblotting. (C) Cells were probed for ATF6α by immunofluorescence, and counter stained with DAPI. Images were taken by a deconvolution fluorescence microscope. (D) Primers across the splice junction of XBP1 were used to amplify XBP1 by semi-Q PCR. The PCR product was divided into two halves. One was subjected to PstI digestion and the other was not, and then resolved on an agarose gel. PCR of GAPDH was used as a control for equal amplification. Note that SCCA1 cells had increased amount of XBP1u and decreased XBP1 splicing. (E) Vector and SCCA1-expressing cells were treated with 5 μg/ml tunicamycin for indicated times. XBP1 transcript was detected by semi-Q PCR. (F–N) SCCA1-expressing MCF10A cells were lentivirally infected with short hairpins of control (shNTC) and PERK (F–H), ATF6α (I–K), or XBP1 (L–N). Cells were harvested 4 days later and qRT-PCR was performed for the transcript level PERK, ATF6α, IL–6, and immunoblotting for XBP1. Data shown are the mean +/− SEM of three independent experiments performed in triplicate. Relative cell growth was determined by crystal violet staining normalized to the reading of cells at Day 1 (G, J, and M). Significance judged by longitudinal data analysis was ***p<0.001 for G and J, and ns for M. Cells were cultured in suspension for 10 days. Phase-contrast images of cell spheres were taken (H, K, and N).

