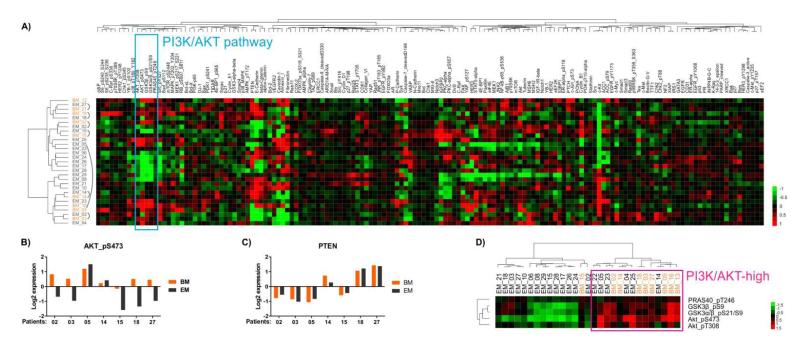
Fig. 3.
Protein expression profiling of brain and extracranial metastases. (A) Unsupervised hierarchical clustering of RPPA data from 152 proteins in nine brain metastases (BM, orange) and 20 extracranial metastases (EM, black). Matched tumors are connected by arced lines. The cyan box highlights five phospho proteins of the PI3K/AKT pathway that clustered together. (B) Log2 expression levels of AKT_pS473 in seven pairs of matched metastases. Each column represents log2 expression value in one tumor. (C) Log2 expression levels of PTEN in seven pairs of matched tumors. (D) Unsupervised hierarchical clustering of 29 unmatched tumors using expression data of five phospho proteins highlighted in (A), which are activation markers of the PI3K/AKT pathway. The magenta box highlights a cluster of tumors with high PI3K/AKT pathway activity.

