Figure 5.
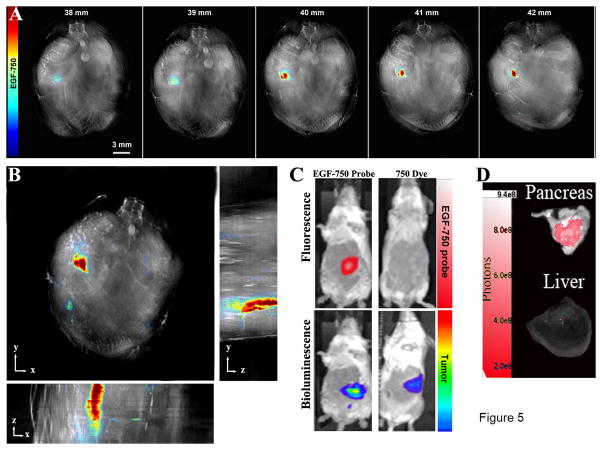
Optical Imaging of Pancreatic Adenocarcinoma. Multispectral optoacoustic detection of pancreatic adenocarcinoma from a mouse at seven days post-implantation, with EGF-750 biodistribution shown at 6 h post injection. High-resolution (75 μm) backprojection reconstruction and multispectral processing using linear regression in MATLAB was used to create reconstructed image. A, serial images of pancreatic tumor mass ranging from 38–43 mm illustrate capability to precisely define region of probe distribution. B, maximum intensity projection of reconstructed image to determine 3D conformation of tumor in xyz-space, enabling measurement of total tumor volume. C, upper panels show fluorescence imaging of EGF-750 probe-labelled pancreatic tumor; as a control, unconjugated inert CF-750 dye was shown to not accumulate preferentially in the tumor. In the lower panels, detection of pancreatic tumor was confirmed using S2VP10L cells (Luc positive) through bioluminescence imaging on the AMI. D, in vivo MSOT images were further validated through fluorescence imaging-detection of EGF-750 probe in pancreatic tumor and liver tissues analyzed ex vivo on the AMI; ex vivo scan of organs confirmed the accumulation in the pancreas and lack of fluorescent EGF-750 probe distribution in the liver, corresponding to MSOT signal quantified for the liver and kidney at <10 MSOT signal units (a.u.).

