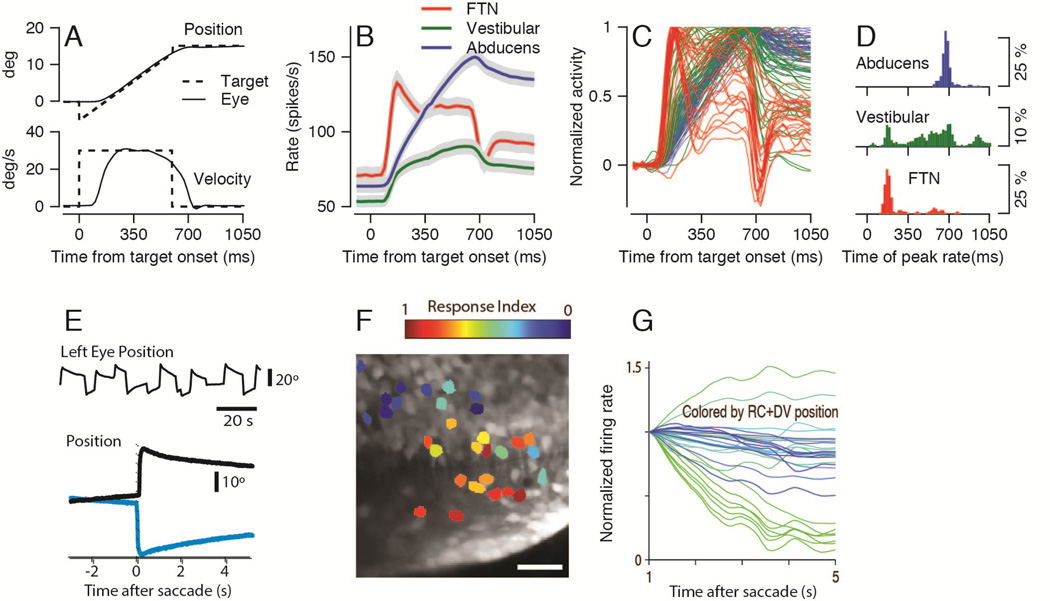
Figure 2. Eye movements and time-varying waveforms of neural integrator activity in zebrafish and monkeys.
A: Top and bottom superimposed traces show horizontal eye position (top) and velocity (bottom) during smooth pursuit eye movements. Solid and dashed lines show eye and target motion parameters. B–C: Each trace shows the time-varying firing rate in the monkey brainstem during the pursuit behavior illustrated in A. Panel B shows averages across functionally identified neuron types and panel C shows firing rate averages from individual neurons. Red, green, and blue traces denote the activity of FTNs, other, non-FTN neurons in the vestibular nucleus, and Abducens neurons. D: Histograms plot the time of peak firing rate using the same color code as in B and C. E: Eye movements of a larva zebrafish. Top, an eye position trace from 100 seconds of spontaneous movements. Bottom, representative eye position trajectories before and after saccades that take eye position toward (black) or away from (green) the side of the integrator under study. F: Image of 29 identified integrator neurons in the brainstem of the larval zebrafish. Neurons are color coded according to how strongly the calcium responses of pairs of neurons co-varied with eye position versus eye velocity. Red versus blue coloring indicates neurons that co-varied strongly with eye position versus eye velocity. G. Each trace shows the estimate of the time varying firing rate of an individual neuron in the zebrafish neural integrator from 1 to 5 seconds after a saccade. Traces are colored according to the location of the cell, which was defined as the sum of the rostrocaudal (RC) and dorsoventral (DV) coordinates. Panels B–D are adapted with permission from Joshua et al. (2013). Panels E–G are adapted with permission from Miri et al. (2011).

