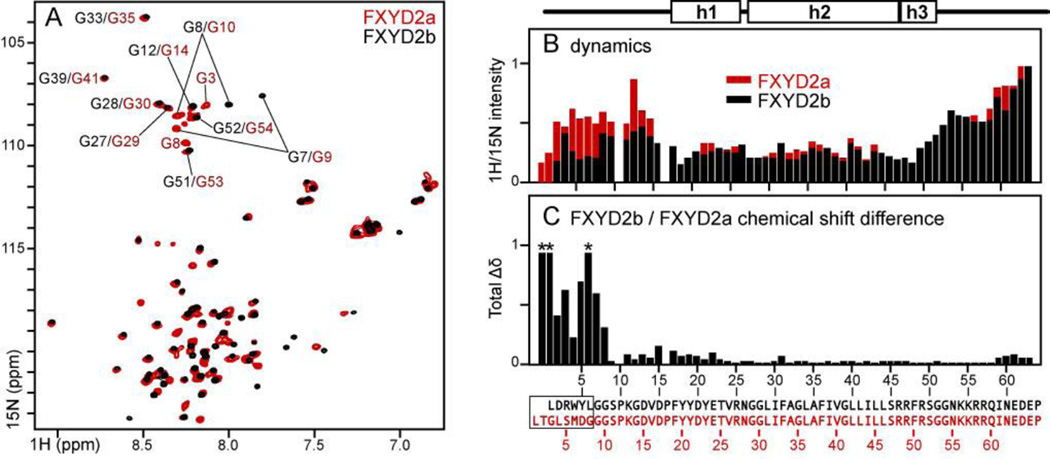
Figure 3. Comparison between FXYD2b and FXYD2a in micelles.
(A) 1H/15N HSQC spectra of FXYD2a (red) and FXYD2b (black) in SDS. (B) Normalized 1H/15N HSQC peak intensities measured for FXYD2b (black) or FXYD2a (red). (C) Total difference in 1H and 15N chemical shifts between FXYD2a and FXYD2b (Δδtot=[(ΔδH)2+(ΔδN/5)2]1/2). ΔδN is scaled by 1/5 to account for the 5-fold difference between the chemical shift dispersions of 15N and 1H. Red asterisks denote cross peaks with Δδtot >1 ppm. Amino acid sequences and numbers at the bottom correspond to FXYD2b (black) or FXYD2a (red). Differences in the N-termini of the two splice variants are enclosed in the box.

