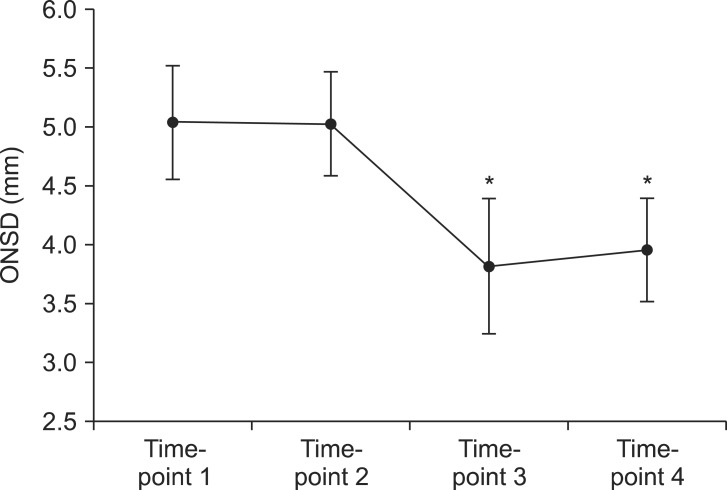
Fig. 2.
The change of sonographic ONSD at four specific time-points. ONSD decreased significantly between time-points 2 and 3 (P < 0.001). ONSD values at time-point 3 and 4 were significantly decreased compared with values at time-point 1 and 2. ONSD did not show differences between two time-points in the same ETCO2 level (time-point 1 vs. 2, and 3 vs. 4). ONSD: optic nerve sheath diameter, ETCO2: end-tidal carbon dioxide concentration. *P < 0.001 (compared with time-point 1 and 2).

