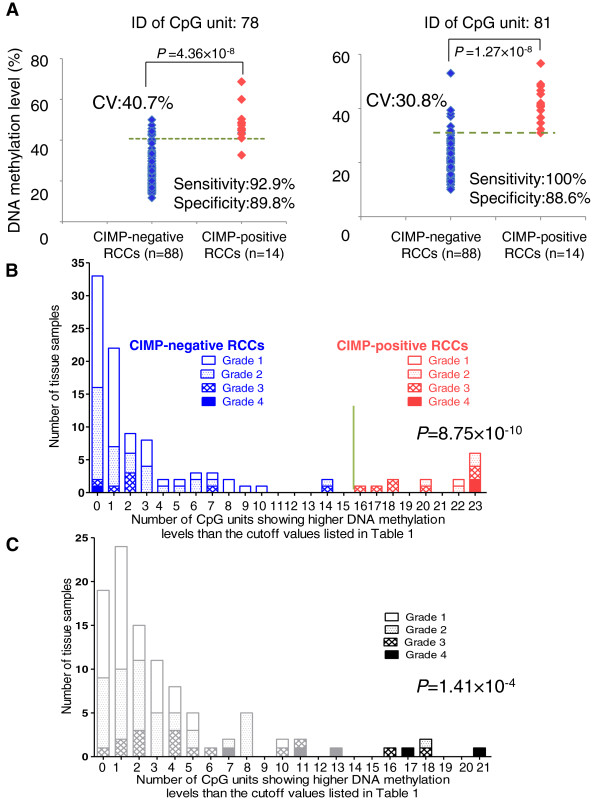
Figure 2.

The criteria for CIMP diagnosis discriminating CIMP-positive from CIMP-negative ccRCCs based on the MassARRAY system. A. Scattergrams of DNA methylation levels of representative CpG units in the learning cohort. Using each CpG unit and its cutoff value (CV) described in Table 1, CIMP-positive ccRCCs were discriminated from CIMP-negative ccRCCs with sufficient sensitivity and specificity. B. Histogram showing the number of CpG units with DNA methylation levels higher than the cutoff values listed in Table 1 in the learning cohort. All 14 ccRCCs (red columns) showing DNA methylation levels higher than the cutoff values at 16 or more CpG units were CIMP-positive ccRCCs, and all 88 ccRCCs (blue columns) showing DNA methylation levels higher than the cutoff values at less than 16 CpG units were CIMP-negative ccRCCs. On the basis of this histogram, we established the following criteria: When the cancerous tissue showed DNA methylation levels higher than the cutoff values at 16 (green bar) or more CpG units, it was judged to be CIMP-positive. The number of CpG units showing higher DNA methylation levels than the cutoff values in CIMP-positive ccRCCs (20.79 ± 0.69) was higher than that of CIMP-negative ccRCCs (2.09 ± 0.32, P = 8.75 × 10⁻¹⁰). C. Histogram showing the number of CpG units with DNA methylation levels higher than the cutoff values listed in Table 1 in the additional 100 ccRCCs comprising the validation cohort. Using the criteria established on the basis of panel B, 5 ccRCCs (black bars) were diagnosed as CIMP-positive ccRCCs, whereas 95 ccRCCs (gray bars) were diagnosed as CIMP-negative ccRCCs. The number of CpG units showing higher DNA methylation levels than the cutoff values in ccRCCs diagnosed as CIMP-positive (18.00 ± 0.84) was higher than that of ccRCCs diagnosed as CIMP-negative (2.73 ± 0.30, P = 1.41 × 10⁻⁴).
