
Figure 6.
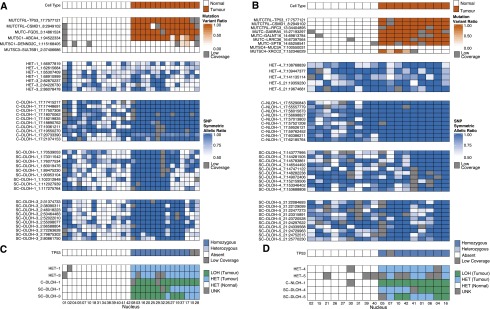
Single-cell validation of subclonal deletions in DG1136g using deep DNA sequencing of individual nuclei. (A,B) The 28 nuclei for Set1 and 18 nuclei for Set2 were designated as tumor and normal cell type using the status of mutations. The mutant allele ratio (variant reads/depth) for mutations and symmetric allele ratio (max(reference reads, variant reads)/depth) for SNP positions are shown for Set1 (A) and Set2 (B) events. Low coverage positions are shaded in gray. (C,D) The LOH status for each event for Set1 (C) and Set2 (D) were determined using the binomial test for dropout and Wilcoxon rank sum test for allelic ratios. TP53 mutation status is shown. The LOH status for each heterozygous (HET) and LOH (C-DLOH, SC-DLOH) event is shown. “Tumor” nuclei having the LOH event (green) or not having the event (blue) are shown to illustrate the original three-component mixture model (Fig. 2A). Normal nuclei are designated “Normal” (white). Unknown events (gray) were inconclusive for HET or LOH status. See Supplemental Methods for details.