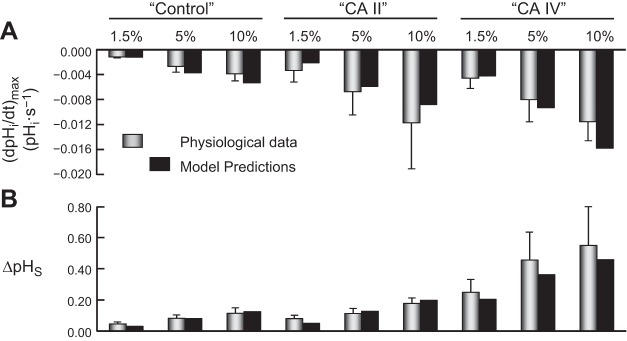
Fig. 10.

Comparison of the physiological data with predictions of the mathematical model for the addition of graded levels of extracellular CO2/HCO3−. A: maximal rates of pHi change (negative direction) produced by the addition of extracellular CO2/HCO3−. B: maximal changes in pHS (positive direction) caused by the addition of extracellular CO2/HCO3−. The physiological data are taken from Fig. 10 of the first paper in this series (14) and Fig. 10 of the second paper (15). Note that here we report the means ± standard deviation (and not SE, as in the previous two papers). The data for model predictions come from Fig. 9 of the present paper.
