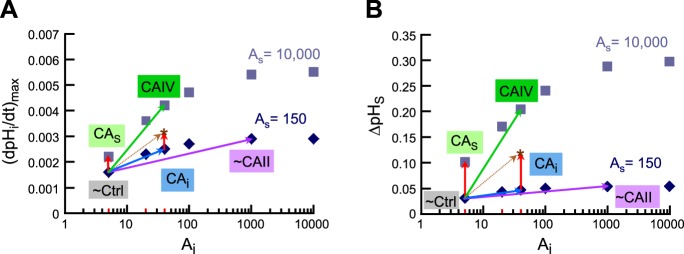
Fig. 13.

Supra-additivity of simultaneous implementation of intracellular (i.e., cytosolic) and extracellular-surface CA activity. A: dependence of (dpHi/dt)max on Ai, for two fixed values of AS (i.e., surface CA isopleths), a replot of selected data from Fig. 8A. B: dependence of ΔpHS on Ai, for two fixed values of AS (i.e., surface CA isopleths), a replot of selected data from Fig. 8B. In all simulations for this figure, we assume that a hypothetical oocyte with the intracellular composition (i.e., initial pHi and ΔpHi) of a “CA IV” oocyte is exposed to a bulk solution containing 1.5% CO2/10 mM HCO3−. The points labeled “∼Ctrl” represent our hypothetical oocyte but with the CA properties of a “control” oocyte (i.e., Ai = 5, on the 150 AS isopleth). The points labeled “∼CAII” represent our hypothetical oocyte but with the CA properties of a “CA II” oocyte (i.e., Ai = 1,000, on the 150 AS isopleth). These points (lavender vectors) approximate the physiologically observed (dpHi/dt)max and ΔpHS values for oocytes injected with CA II. The points labeled “CAS” represent a hypothetical oocyte but in which we raise AS to 10,000 but leave Ai = 5. These points (red vectors on left side of panels) represent (dpHi/dt)max and ΔpHS values that are far smaller than those physiologically observed with oocytes expressing CA IV. The points labeled “CAi” represent a hypothetical oocyte but in which we raise Ai to 40 but leave AS = 150. These points (blue vectors) represent (dpHi/dt)max and ΔpHS values that are far smaller than those physiologically observed with oocytes expressing CA IV. The sum of the red and blue vectors produce the brown vectors, which indicate the effects of simply adding CAi and CAo. Note that the asterisks (at the head of the brown vectors) represent (dpHi/dt)max and ΔpHS values that are still much smaller than those physiologically observed with oocytes expressing CA IV. Finally, the points labeled “CAIV” represent the combination of simultaneously raising AS from 150 to 10,000 and raising Ai from 5 to 40 in our simulations (green vectors). These points do indeed approximate the physiologically observed (dpHi/dt)max and ΔpHS values of oocytes expressing CA IV.
