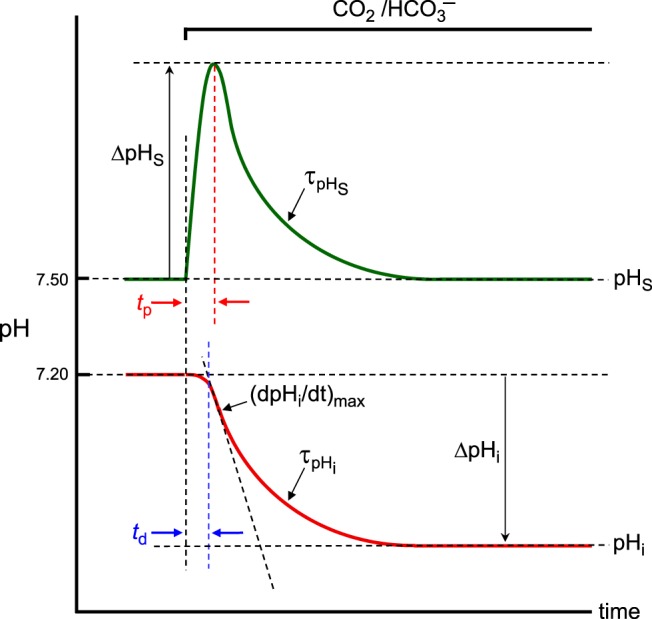
Fig. 2.

Summary of the key quantities of interest for describing intracellular-pH (pHi) and surface pH (pHS) transients in our physiological experiments during the addition of CO2/HCO3−. This figure schematically illustrates the transients of pHi (in red) and pHS (in green) and some of the experimentally measurable key quantities as we expose an oocyte to a CO2/HCO3− solution. For pHi, key quantities are time delay (td), the maximal rate of pHi descent [(dpHi/dt)max], time constant for pHi decay (τpHi), and the difference between initial and final pHi (ΔpHi). For pHS, key quantities are time to peak (tp), maximal height of the pHS trajectory (ΔpHS), and the time constant for pHS decay (τpHS).
