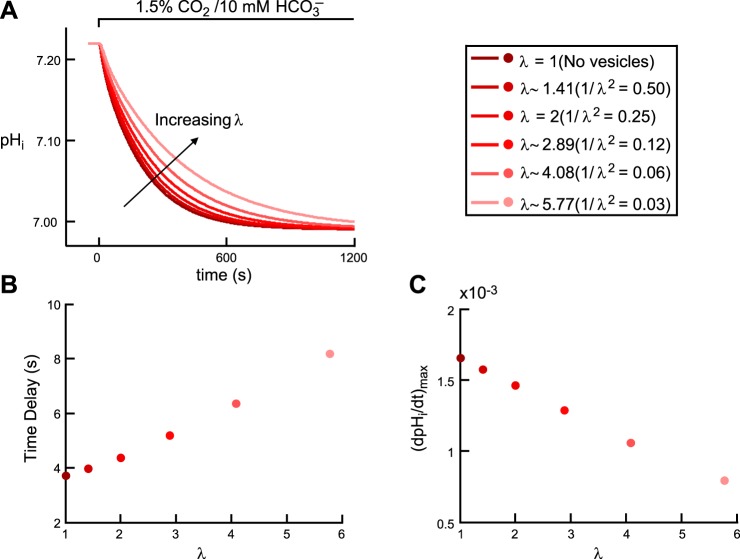
Fig. 4.
Effect of intracellular vesicles on the pHi transient during the addition of CO2/HCO3−. A: pHi trajectories, at a depth of ∼50 μm. The six simulations correspond to six increasing values of the tortuosity factor λ. B: time delay as a function of λ. The six colored dots correspond to the six simulations in A. C: maximal rate of pHi change (negative direction) as a function of λ. The six colored dots correspond to the six simulations reported in A.

