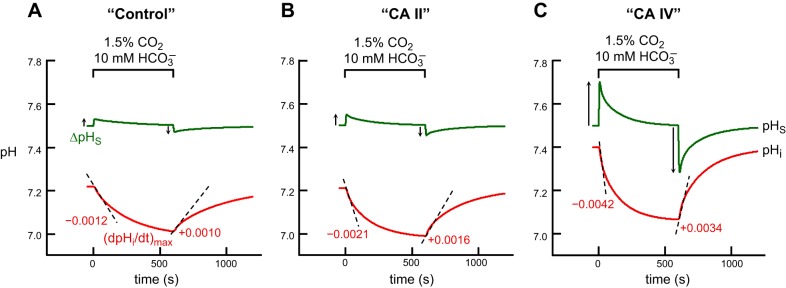
Fig. 6.

Simulations of pHi and pHS transients for the addition and removal 1.5% CO2/10 mM HCO3− in 5 mM HEPES. A: “control” oocyte“. B: ”CA II“ oocyte. C: ”CA IV“ oocyte. The pHi transients, calculated at a depth of ∼50 μm into the oocyte, are represented by the red lower trajectories, and pHS, by the green upper trajectories. At the indicated time, we switched the extracellular solution from CO2/HCO3−-free ”ND96“ to 1.5% CO2/HCO3− (see Eq. 9). The dashed black lines through the initial portions of the pHi transients for CO2 application and removal represent the maximal rates of pHi change (negative or positive direction), as predicted by the model. The upward and downward arrows near the pHS records represent maximal changes in pHS (positive or negative direction).
