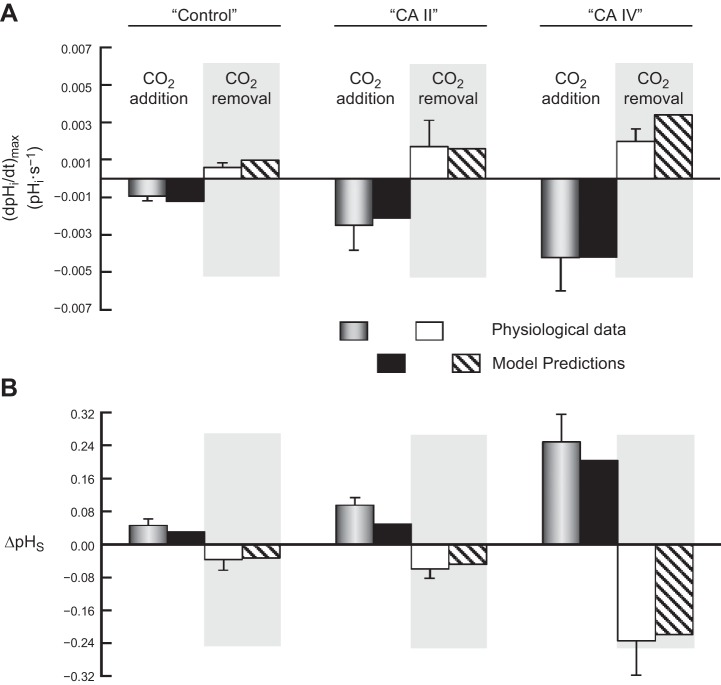
Fig. 7.
Comparison of the physiological data with predictions of the mathematical model for the addition and removal of extracellular 1.5% CO2/10 mM HCO3−. A: maximal rates of pHi change (negative or positive direction) produced by the addition or removal of extracellular CO2/HCO3−. B: maximal changes in pHS (positive or negative direction) caused by the addition or removal of extracellular CO2/HCO3−. The physiological data come from Fig. 2 of the first paper in this series (14) and Fig. 3 of second paper (15). Note that here we report the means ± standard deviation (and not SE, as in the previous two papers). The data for model predictions come from Fig. 6 of the present paper.

