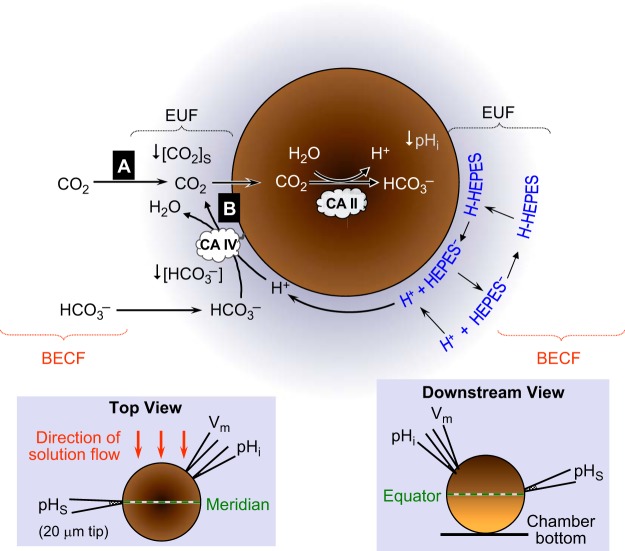
Fig. 1.
Model of an oocyte exposed to CO2/HCO3−. The main part of the figure illustrates the diffusion and reaction events as CO2 enters an oocyte. The black arrows with sharp heads indicate solute diffusion in the extracellular unconvected fluid (EUF) and intracellular fluid. The black arrows with dull heads indicate reactions. The left inset is a schematic top view of the oocyte in the chamber, as seen through the microscope. The orange arrows indicate the direction of convective flow of the bulk extracellular fluid (BECF). The right inset is a schematic view of the oocyte along the axis of convective flow, looking downstream. The darker half of the oocyte, oriented upward, is the animal pole. CA II, carbonic anhydrase II; pHi, intracellular pH; pHS, surface pH.

