
Fig. 11.
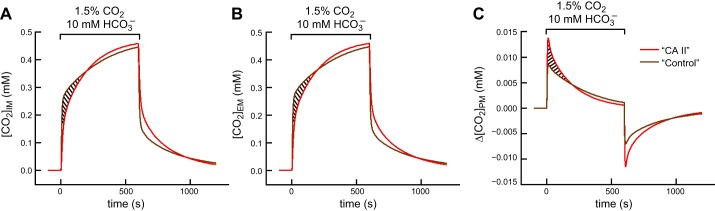
Predictions of the mathematical model for concentration-time profiles of CO2 for a “CA II” oocyte (red curves) and a “Control” or “Tris” oocyte (brown curves). A: [CO2] at the intracellular surface of the plasma membrane (IM). B: [CO2] at the extracellular surface of the plasma membrane (EM). C: gradient of CO2 across the plasma membrane (PM), the result of subtracting values in B from corresponding values in A. The hatched areas in A and B identify the initial phase of CO2 influx, during which the model predicts that cytosolic CA decreases [CO2] at the inner and outer surfaces of the plasma membrane. However, the dominant effect is at the inner membrane, so that CA provides a larger gradient for CO2 influx, as indicated by the hatched area in C. Details of the mathematical model are presented in the third paper in this series (49).