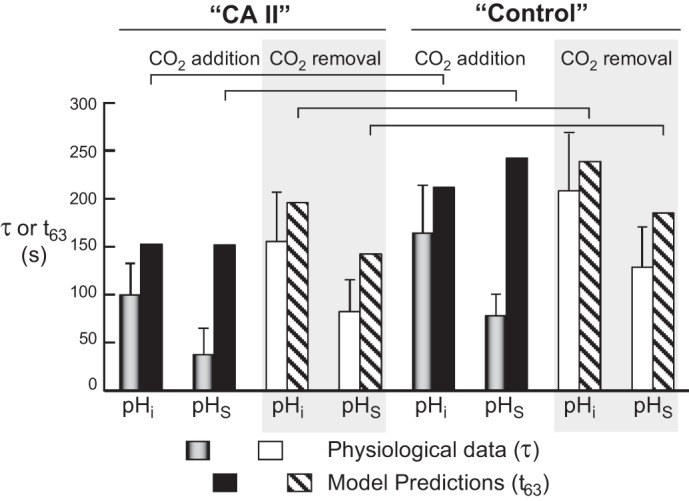
Fig. 13.

Comparison of physiological τ data with t63 data predicted by the mathematical model. The physiological data are taken from Fig. 6; note that here we report the means ± standard deviation (and not SE, as in Fig. 6). An apparent inconsistency arises when we compare pHS data from physiological experiments (time constant, τ) and simulations (time to 63% of completion, t63) for CO2 addition, under both CA II and control conditions. The inconsistency probably arises, in part, because of the multiexponential decay of the simulated pH trajectory, the special nature of the pHS trajectory beneath the pHS electrode, and the asymmetry of pHS over the oocyte surface. Details of the mathematical model are presented in the third paper in this series (49).
