Fig. 14.
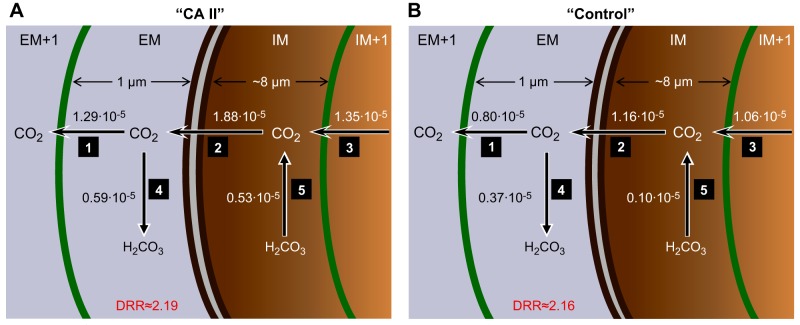
Predictions of the mathematical model for maximal CO2 diffusion and reaction fluxes near the plasma membrane during removal of 1.5% CO2/10 mM HCO3−. A: “CA II” oocyte. B: “Control” or “Tris” oocyte. The parallel dark brown curves identify the plasma membrane (PM). The green curves to the left and right of the PM represent the spatial discretizations for the numerical solutions. The numbers near the arrows 1 through 5 indicate the maximal diffusive fluxes (sharp arrowheads) and reaction fluxes (dull arrowheads) in units of μmol/s. These maximal fluxes occur within ∼1 s of each other. The diffusion/reaction ratio (DRR) is the quotient of flux no. 1/flux no. 4. Details of the mathematical model are presented in the third paper in this series (49).

