
Fig. 16.
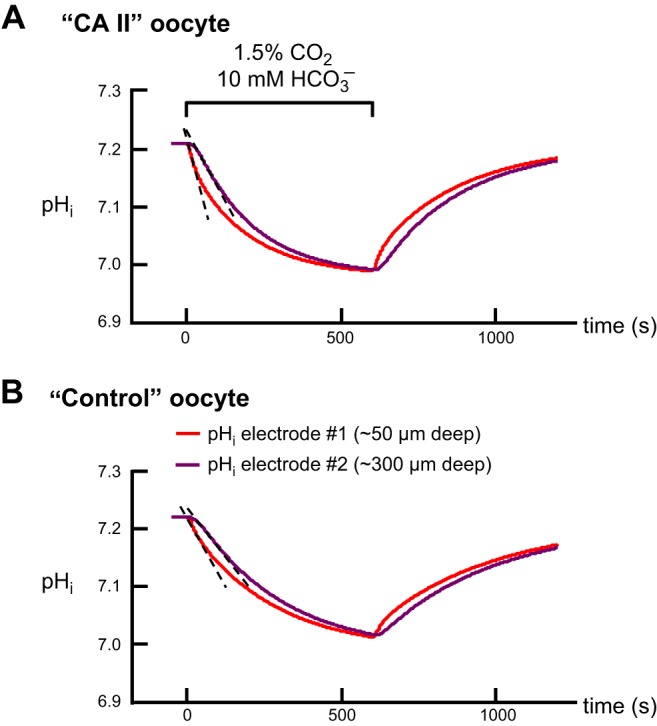
Predictions of the mathematical model for pHi trajectories at depths of ∼50 μm and ∼300 μm. A: simulations for a “CA II” oocyte. B: simulations for a “Control” or “Tris” oocyte. In these simulations, which are comparable to the physiological experiments in Fig. 7, the tortuosity factor (λ) used to simulate a layer of intracellular vesicles is ∼3.16. Details of the mathematical model are presented in the third paper in this series (49).