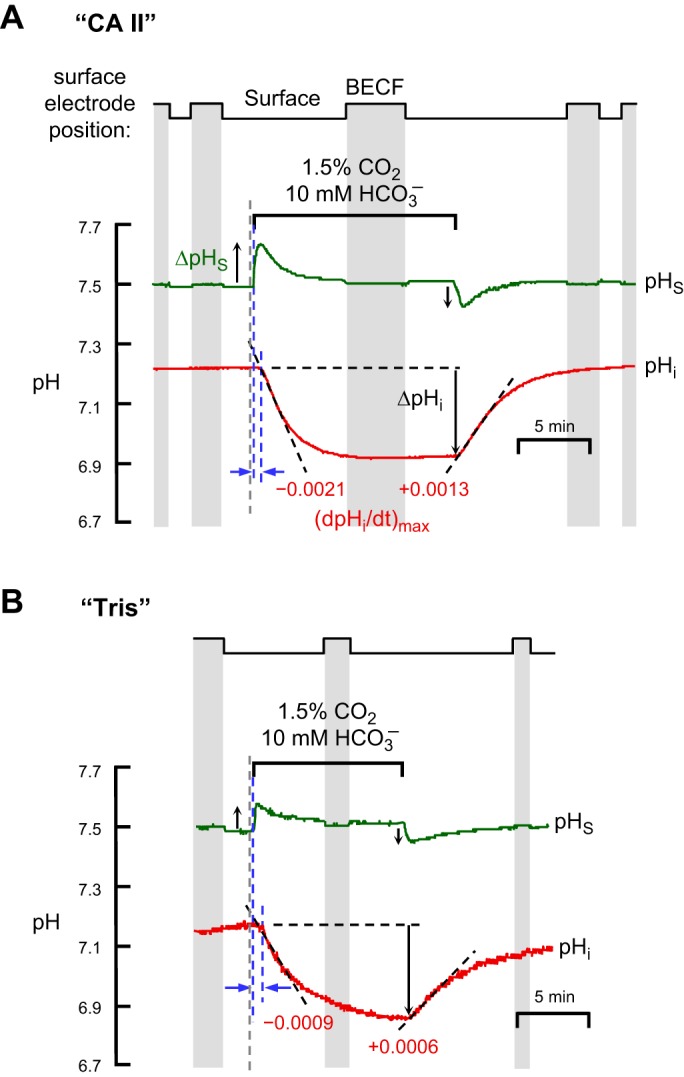
Fig. 2.

Representative experiments showing effects of CA II on pHi and pHS changes evoked by application and removal of CO2/HCO3−. A: oocytes injected with recombinant human CA II dissolved in Tris buffer. B: oocytes injected only with Tris buffer. Both in “CA II” or “Tris” oocytes, the pHi trace is represented by the red lower record, and pHS, by the green upper record. At the indicated times, we switched the extracellular solution from ND96 to 1.5% CO2/10 mM HCO3−/pH 7.50 (Table 1) and then back again. In this example, the extracellular solution flowed at 2 ml/min and the sampling rate was 1 per 1,000 ms. The vertical gray bands represent periods during which the pHS electrode was withdrawn to the BECF for calibration. At other times the pHS electrode was dimpling ∼40 μm into the oocyte surface. The gray, dashed vertical lines represent the times that the computer switched the valves to initiate a change of solutions. The left and right blue, dashed vertical lines (see results) represent the initiation of the pHS and pHi transients, respectively. The dashed black lines through the initial portions of the pHi records for CO2 application and removal represent best linear fits for maximal rates of pHi change (negative or positive direction). The downward vertical arrows near the pHi records represent the CO2-induced changes in steady-state pHi. The upward and downward arrows near the pHS records represent maximal changes in pHS (positive or negative direction).
