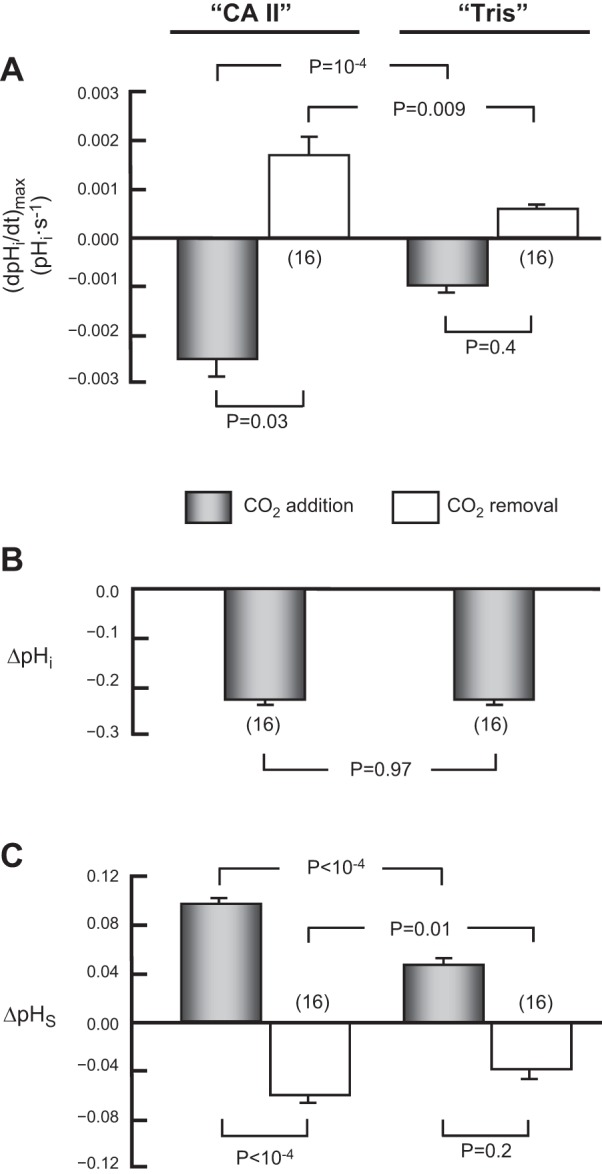
Fig. 3.

Summary of effects of CA II on pHi and pHS. This figure summarizes results from a larger number of experiments, such as those in Fig. 2, on oocytes injected with CA II in Tris buffer, or only Tris buffer. In each case, we switched the extracellular solution from ND96 to 1.5% CO2/10 mM HCO3− (gray bars) and vice versa (white bars). A: maximal rates of pHi change (negative or positive direction) produced by the extracellular solution switch. B: changes in steady-state pHi, induced by the addition of CO2/HCO3−. C: maximal changes in pHS (positive or negative direction) caused by the extracellular solution switch. This summary includes all oocytes injected with CA II (and exposed to 1.5% CO2 in 5 mM HEPES) in the present study, as well as their day-matched Tris-injected controls. Values are means ± SE, with nos. of oocytes in parentheses. We performed a one-way ANOVA (overall P values: P < 10−4 in A, and P < 10−4 in C), followed by a Student-Newman-Keuls (SNK) analysis (P shown for individual comparisons). We performed a paired t-test in B. The mean initial pHi for “CA II” oocytes in the CO2/HCO3−-free ND96 solution was 7.21 ± 0.05 (n = 16). This mean is not significantly different from that for “Tris” oocytes, 7.22 ± 0.03 (n = 16; P = 0.93).8
