Fig. 4.
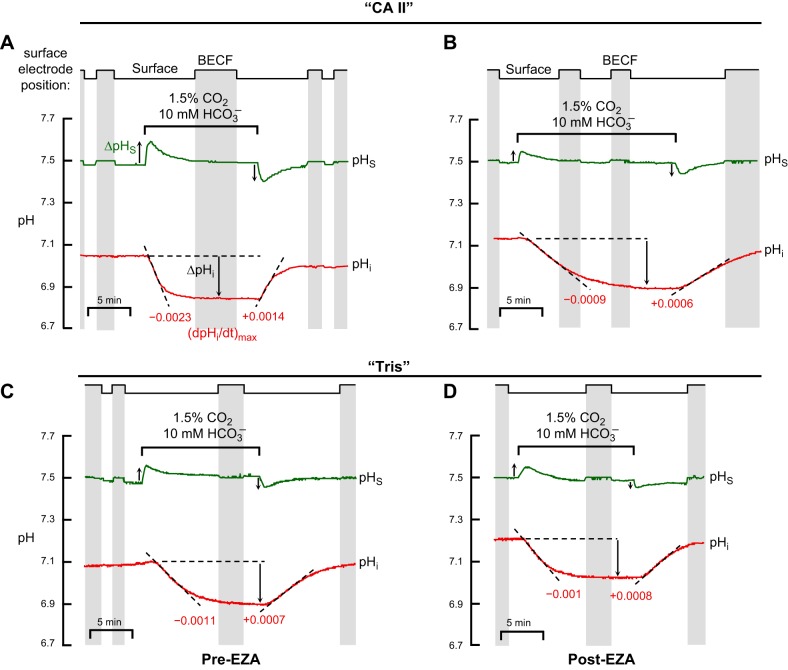
Representative experiments showing effects of ethoxzolamide (EZA) EZA on pHi and pHS. A: oocyte injected with recombinant human CA II dissolved in Tris buffer, assayed before treatment with EZA (Pre-EZA). B: “CA II” oocyte, assayed after a 3-h treatment with EZA (Post-EZA). C: oocyte injected only with Tris buffer, assayed before treatment with EZA. D: “Tris” oocyte, assayed after a 3-h treatment with EZA. For both CA II and Tris experiments, the Pre-EZA and Post-EZA pHi and pHS records were obtained from the same oocytes. Between the two CO2/HCO3− exposures, the oocytes were exposed for 3 h to the ND96 solution (Table 1) supplemented with 400 μM EZA, followed by 3 washes in ND96, and incubation in ND96 (30 min to 3 h). We noticed no effect of the variable duration of the post-EZA incubation. The extracellular solutions were ND96 and, during the indicated time, 1.5% CO2/10 mM HCO3−/pH 7.50. In both experiments, the solution flowed at 2 ml/min and the sampling rate was 1 per 1,000 ms. The vertical gray bands represent periods during which the pHS electrode was withdrawn to the BECF for calibration. The dashed black lines through the initial portions of the pHi records for CO2 application and removal represent best linear fits for maximal rates of pHi change (negative or positive direction). The downward vertical arrows represent CO2-induced change in steady-state pHi. The upward and downward vertical arrows near the pHS records represent the maximal CO2-induced changes in pHS (positive or negative direction).

